A Stronger Jobs Print, With No New CPI
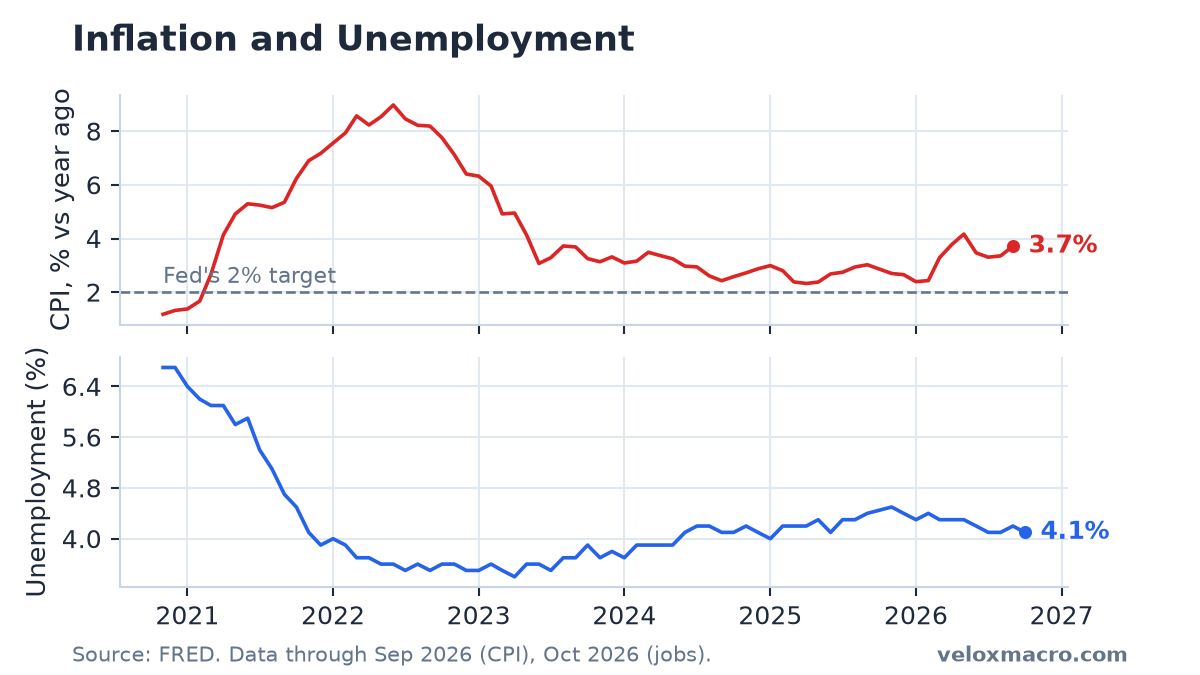
October nonfarm payrolls rose 165,000, and the unemployment rate fell to 4.1% from 4.2%. Prior months were revised higher. September CPI is still the latest inflation reading, at about 3.7%. On Thursday, November 5, the session before the Friday morning jobs report, SPY fell 4.41% and the VIX jumped to 28.18.
New to CPI and jobs data? Start with our guide to CPI, the unemployment rate, and our weekly archive.
Key Market Data (session close: November 5, 2026)
The tables below reflect the Thursday, November 5, 2026 U.S. close. Weekly changes run from the October 29 close. The October employment report was released Friday morning, November 6. CPI is still the September print. The effective fed funds rate is the daily FRED series (DFF), not the monthly average. This analysis was published on November 9 and uses only data available through Thursday’s close for market prices, plus the Friday morning jobs release.
| Ticker | Close | Daily % Change | Weekly % Change |
|---|---|---|---|
| SPY | 733.00 | -4.41% | -4.73% |
| QQQ | 647.05 | -6.49% | -9.55% |
| AAPL | 344.17 | -1.53% | -1.36% |
| MSFT | 535.93 | -3.58% | +1.09% |
| NVDA | 181.60 | -9.26% | -15.01% |
| TSLA | 343.69 | -10.77% | -14.78% |
| Indicator | Latest Value | As Of | Notes |
|---|---|---|---|
| Unemployment Rate (UNRATE) | 4.1% | 2026-10-01 | Down from 4.2% in September |
| Nonfarm Payrolls (PAYEMS) | +165K | 2026-10-01 | October gain; September revised to +60K |
| CPI Index (CPIAUCSL) | 336.298 | 2026-09-01 | September; about 3.7% y/y; no October print yet |
| Core CPI (CPILFESL) | 338.896 | 2026-09-01 | Ex food and energy; about 2.6% y/y |
| Effective Fed Funds Rate (DFF) | 3.88% | 2026-11-04 | Held after the October 28 decision |
| 10-Year Treasury Yield (^TNX) | 4.84% | 2026-11-05 | Daily -1.16%; weekly -3.05% |
| 10-Year Treasury (FRED DGS10) | 4.90% | 2026-11-04 | Official daily series, one session behind ^TNX |
| 2-Year Treasury (FRED DGS2) | 4.58% | 2026-11-04 | Most sensitive to expected Fed policy |
| VIX Index (^VIX) | 28.18 | 2026-11-05 | Daily +69.66%; weekly +63.84% |
| US Dollar Index (DX-Y.NYB) | 101.55 | 2026-11-05 | Daily +0.04%; weekly -0.48% |
| WTI Crude Oil (CL=F) | $90.52 | 2026-11-05 | Daily +2.72%; weekly -11.25% |
| 30-Year Mortgage Rate (MORTGAGE30US) | 7.18% | 2026-11-05 | Freddie Mac weekly average |
October Jobs: Hiring Rebounded, Unemployment Eased
Nonfarm payrolls rose 165,000 in October. That is a clear step up from the soft stretch earlier in the fall. The Bureau of Labor Statistics also revised the two prior months higher. On the current vintage, August is a gain of 186,000, up from the 133,000 first reported in our earlier write-up, and September is a gain of 60,000, up from 29,000. Revisions of that size change the recent path of hiring. They do not change October’s own print.
The unemployment rate fell to 4.1% from September’s 4.2%. That puts the rate back where it was in July and August. The labor market in this report looks firmer than the September package did, not weaker.
The Federal Reserve held the target range at 3.75% to 4% on October 28. The effective fed funds rate is still 3.88%. A stronger payrolls month with unemployment back at 4.1% is not, by itself, a signal of what the committee will do next. It is one more data point on the employment side of the dual mandate.
Inflation: Still Waiting on October CPI
September CPI remains the latest inflation reading. The index is at 336.298, about 3.7% above a year earlier. Core CPI, which leaves out food and energy, is about 2.6%. There is no October CPI print in this release cycle yet. The next CPI report is due in mid-November. Dates are on the economic calendar. We covered the September print in the October 15 CPI and jobs analysis.
Oil has moved a long way since that September print. WTI closed Thursday at $90.52, after a week that included closes near $104 at the end of October and an $88.12 low on Wednesday. Energy feeds the headline CPI basket with a lag. A stretch of oil near $90 would pull the next headline rate in a different direction from oil near $100. It does not rewrite September’s 3.7%.
What the Market Did Before the Report
Thursday was the sharpest equity session in months, and it closed before the Friday morning jobs release. SPY fell 4.41% to 733.00, about 5.9% below its October 6 record. QQQ fell 6.49% to 647.05, about 14.8% below its own record. NVIDIA dropped 9.26% to 181.60. Tesla dropped 10.77% to 343.69. The VIX jumped 69.66% to 28.18, the highest close since March 30 and the first close above 25 since April 7.
Wednesday had been a bounce. SPY closed at 766.81, Apple at a record 349.51, and Microsoft at a record 555.80, with the VIX at 16.61. Thursday erased that bounce and more. The numbers alone do not identify a single cause. They show a broad risk-off day in stocks and options, with the growth sleeve hit harder than the S&P 500.
Bond yields fell with equities. The 10-year yield finished near 4.84%, down from about 4.89% on Wednesday and from 5.31% on October 5. FRED’s official 10-year through Wednesday was 4.90%. The 2-year yield was 4.58% on Wednesday, about 70 basis points above the 3.88% effective funds rate and well below the 4.84% reading on October 5. The 10-year breakeven inflation rate was 2.24% on Thursday. Freddie Mac’s November 5 survey put the 30-year mortgage rate at 7.18%, the lowest weekly average since September 24.
How to Read Jobs and Inflation Together
The Fed’s dual mandate is maximum employment and price stability. This week’s jobs report improves the employment side relative to September. The price side is unchanged until October CPI arrives. That is a different mix from the September package, when inflation had jumped to 3.7% and payrolls had looked soft before revisions.
- Stronger jobs, unchanged CPI: The awkward soft-jobs story from September is less clear after revisions and October’s 165,000 gain.
- One report is not a trend: October hiring can cool again. The revised August and September levels show how much one vintage can move.
- Oil near $90: Helps the next headline CPI path relative to oil near $100. Core CPI still matters more for the medium-term inflation read.
What to Watch
- October CPI. Due in mid-November. Another print near 3.7% would keep the inflation side hot against a firmer jobs backdrop.
- Whether Thursday’s equity drop extends. A 4.41% SPY decline and a VIX at 28.18 are large enough that the next few sessions matter more than the jobs print alone.
- The 2-year yield near 4.58%. It has done most of the work of marking down the near-term policy path since early October.
- December 9. The next Fed decision includes a new Summary of Economic Projections.
This is not financial advice.