A Small Rebound in Yields After Monday’s Low
The 10-year Treasury yield finished Tuesday, November 3, at 4.95%, about 6 basis points above Monday’s 4.89% close. SPY rose 0.30% and QQQ rose 0.62%, a partial bounce after Monday’s drop. Oil stayed near $96 after Monday’s 7% decline.
New to Treasury yields? Start with our complete guide to the 10-year yield and weekly archive.
Key Market Data (session close: November 3, 2026)
The tables below reflect the Tuesday, November 3, 2026 U.S. close. Weekly changes run from the October 27 close. FRED’s daily Treasury series are published about one business day later, so their latest values here are for Monday, November 2. This analysis was published on November 4 and uses only data available at Tuesday’s close.
| Ticker | Close | Daily % Change | Weekly % Change |
|---|---|---|---|
| SPY | 754.35 | +0.30% | -1.99% |
| QQQ | 685.28 | +0.62% | -4.99% |
| AAPL | 331.90 | -1.90% | -4.38% |
| MSFT | 520.99 | +2.74% | -1.95% |
| NVDA | 206.69 | +2.29% | -5.16% |
| TSLA | 398.50 | -1.32% | -2.20% |
| Indicator | Latest Value | As Of | Notes |
|---|---|---|---|
| US 10-Year Treasury (^TNX) | 4.95% | 2026-11-03 | Daily +1.19%; weekly -0.82% |
| 10-Year Treasury (FRED DGS10) | 4.91% | 2026-11-02 | Official daily series |
| 2-Year Treasury (FRED DGS2) | 4.59% | 2026-11-02 | Most sensitive to expected Fed policy |
| 30-Year Treasury (FRED DGS30) | 5.28% | 2026-11-02 | Long end of the curve |
| 10-Year TIPS Real Yield (FRED DFII10) | 2.62% | 2026-11-02 | Yield after inflation |
| 10-Year Breakeven Inflation (FRED T10YIE) | 2.30% | 2026-11-03 | Inflation expected by bond investors |
| 30-Year Mortgage Rate (MORTGAGE30US) | 7.24% | 2026-10-29 | Freddie Mac weekly average |
| Effective Fed Funds Rate (DFF) | 3.88% | 2026-11-02 | Held after the October 28 decision |
| VIX Index (^VIX) | 20.83 | 2026-11-03 | Daily -1.51%; weekly +18.89% |
| US Dollar Index (DX-Y.NYB) | 101.87 | 2026-11-03 | Daily +0.12%; weekly -0.44% |
| WTI Crude Oil (CL=F) | $96.09 | 2026-11-03 | Daily -0.38%; weekly -3.81% |
| CPI Index (CPIAUCSL) | 336.298 | 2026-09-01 | September index, about 3.7% above a year earlier |
Still Near 4.9%, Not a Break Higher
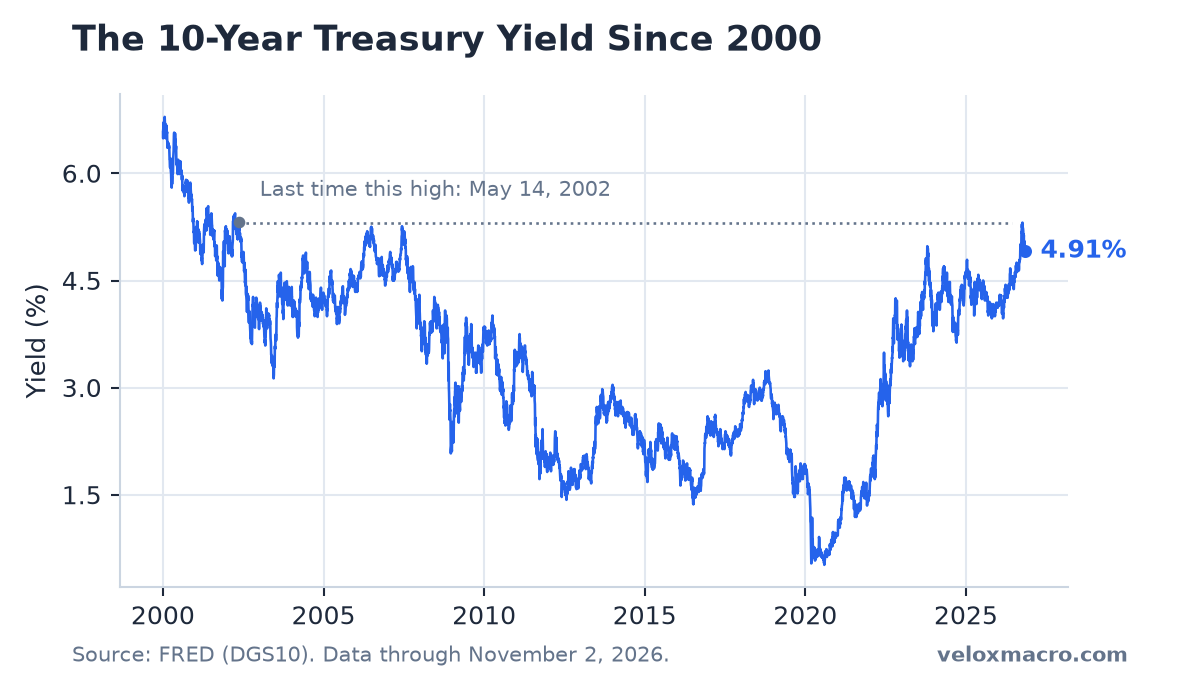
Tuesday’s 1.19% rise in ^TNX is about 6 basis points, from 4.89% to 4.95%. Over the week from October 27 the yield is down about 4 basis points, from 4.99%. Since the October 5 high of 5.31%, the market quote is down about 36 basis points. Tuesday recovered part of Monday’s decline. It did not put the yield back above 5%.
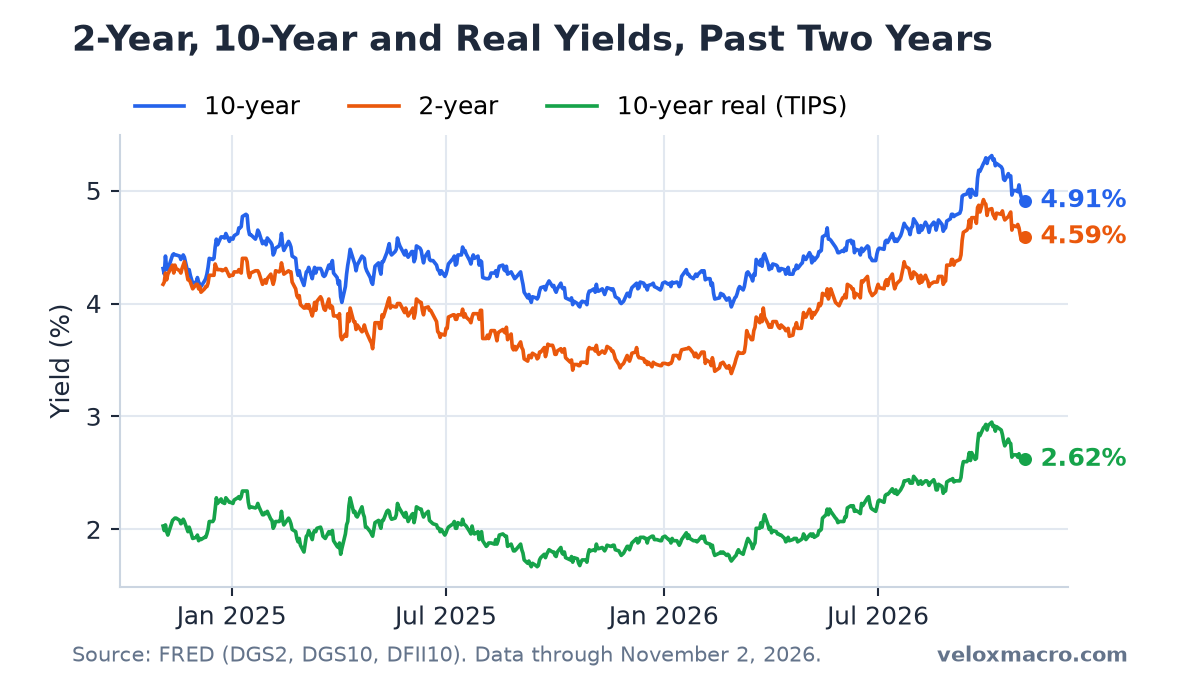
FRED’s official 10-year was 4.91% on November 2, down from 4.94% on October 30 and from 5.00% on October 26. The path since the Fed held on October 28 has been lower, then a pause: 5.05% on the decision day, then 4.98%, 4.94% and 4.91%.
Real Yields Still Lead, Breakevens Softened
FRED’s readings through November 2, compared with October 5:
- 10-year yield: 5.31% to 4.91%, down 40 basis points.
- 10-year real yield: 2.95% to 2.62%, down 33 basis points.
- 10-year breakeven inflation: 2.36% to 2.29%, down 7 basis points.
Earlier in the retreat from 5.31%, almost all of the move was the real yield and the breakeven rate barely moved. The last week added a small soft patch in breakevens, to 2.29% on Monday and 2.30% on Tuesday. Real yields still account for most of the decline from the high. The longer account of the climb is in Why the 10-Year Treasury Yield Hit Its Highest Level Since 2002.
The 2-Year Is 71 Basis Points Above the Funds Rate
The 2-year yield was 4.59% on November 2. That is 11 basis points below the October 27 reading of 4.70%, and about 25 basis points below the October 5 reading of 4.84%. The October 30 print of 4.56% was the low of this stretch. Monday was a small bounce from that low.
The 2-year is about 71 basis points above the effective fed funds rate of 3.88%. That gap has narrowed from about 80 basis points in late October. The Federal Reserve held the target range at 3.75% to 4% on October 28. The effective rate did not move. The next decision with a new Summary of Economic Projections is December 9. The October meeting write-up is in What the Data Says Ahead of the October 28 Fed Decision.
Oil Stayed Near $96, Mortgages Still at 7.24%
WTI finished at $96.09, down another 0.38% after Monday’s 7.36% drop to $96.46. Two sessions under $100 reverse the late-October stretch above that line. A lower oil price feeds the next headline CPI print with a lag. It does not change September’s reading of about 3.7%.
Freddie Mac’s latest survey, on October 29, left the 30-year mortgage rate at 7.24%, down from 7.32% the week before. The next survey is due later this week. The gap versus a 10-year near 4.9% is still a bit wider than 2 percentage points.
Stocks Bounced; Apple Kept Falling
SPY gained 0.30% to 754.35, about 3.2% below its October 6 record. QQQ gained 0.62% to 685.28 and is about 9.8% below its own record. Over the week from October 27, SPY is still down 1.99% and QQQ is down 4.99%. Tuesday repaired part of Monday. It did not repair the week.
Microsoft rose 2.74% to 520.99 after Monday’s 2.83% drop. NVIDIA rose 2.29% to 206.69. Apple fell another 1.90% to 331.90, about 4.9% under the October 29 high of 348.91. Tesla fell 1.32% to 398.50. The VIX eased 1.51% to 20.83 and stayed above 20 for a second session. Monday’s close of 21.15 was the first reading above 20 since July 29; that session is covered in the November 2 VIX analysis.
What to Watch
- The November 6 jobs report. September payrolls rose 29,000 and unemployment was 4.2%. The 2-year yield at 4.59% is the rate that has been moving first when the policy outlook shifts. Times are on the economic calendar.
- Whether 4.95% holds. Monday’s 4.89% was the low of this move. Tuesday bounced. A move back through 5.05%, the October 28 close, would reverse the post-decision decline.
- The real yield near 2.62%. It has done most of the work since 5.31%. A jump in the breakeven rate from 2.30% would be a different kind of selloff.
- Oil near $96. Two closes under $100 matter for the next CPI print only if they stick.
This is not financial advice.