Thursday’s Crash, Then a Modest Friday Bounce
SPY lost 2.70% in the week to November 6 and QQQ lost 4.98%. The VIX spiked to 28.18 on Thursday, then closed Friday at 25.64. October payrolls rose 165,000 and unemployment fell to 4.1%. The 10-year yield finished the week near 4.86%.
Weekly changes run from the October 30 close to the November 6 close.
Weekly Market Data (week ending November 6, 2026)
The stock table leads with the weekly change; Friday’s daily change is there for context. Macro rows use each indicator’s own as-of date. October jobs are in; CPI is still the September print. This analysis was published on November 9 and uses only data available at Friday, November 6’s close.
| Ticker | Week-Ending Close (USD) | Weekly % Change | Friday Daily % |
|---|---|---|---|
| SPY | 735.29 | -2.70% | +0.31% |
| QQQ | 656.10 | -4.98% | +1.40% |
| AAPL | 342.37 | -0.66% | -0.52% |
| MSFT | 530.61 | +1.67% | -0.99% |
| NVDA | 186.64 | -8.80% | +2.78% |
| TSLA | 358.22 | -10.40% | +4.23% |
| Indicator | Latest Value | As Of | Weekly % Change |
|---|---|---|---|
| 10-Year Treasury Yield (^TNX) | 4.86% | 2026-11-06 | -1.42% |
| 10-Year Treasury (FRED DGS10) | 4.84% | 2026-11-05 | — |
| 2-Year Treasury (FRED DGS2) | 4.46% | 2026-11-05 | — |
| VIX (CBOE Volatility Index) | 25.64 | 2026-11-06 | +32.03% |
| US Dollar Index (DX-Y.NYB) | 102.30 | 2026-11-06 | +0.41% |
| WTI Crude Oil (CL=F) | $90.83 | 2026-11-06 | -12.76% |
| 30-Year Mortgage Rate (MORTGAGE30US) | 7.18% | 2026-11-05 | — |
| Effective Fed Funds Rate (DFF) | 3.88% | 2026-11-05 | — |
| Unemployment Rate (UNRATE) | 4.1% | 2026-10-01 | — |
| Nonfarm Payrolls (PAYEMS) | +165K | 2026-10-01 | — |
| CPI Index (CPIAUCSL) | 336.298 | 2026-09-01 | — |
SPY vs QQQ: The Week Was Thursday
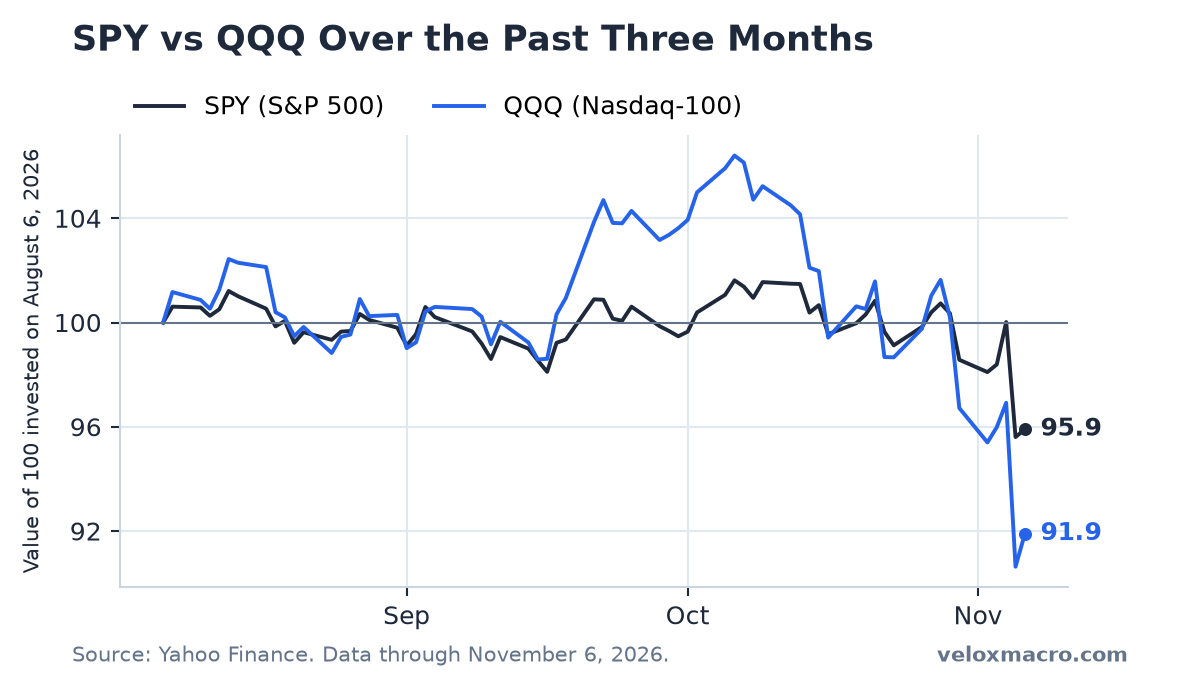
Through Wednesday the week still looked recoverable. SPY rose from Friday’s 755.72 to 766.81 on Wednesday. QQQ rose from 690.49 to 691.95. Thursday reversed that in one session. SPY fell 4.41% to 733.00. QQQ fell 6.49% to 647.05. Friday repaired a slice of the damage: SPY gained 0.31% to 735.29, and QQQ gained 1.40% to 656.10.
For the full week SPY lost 2.70% and QQQ 4.98%. The growth sleeve again did worse. SPY is about 5.6% below its October 6 record of 779.09. QQQ is about 13.6% below its October 6 record of 759.66. Our SPY vs QQQ guide explains how to read a week when the Nasdaq-100 lags the S&P 500.
Mega-Caps: Tesla and NVIDIA Led the Damage
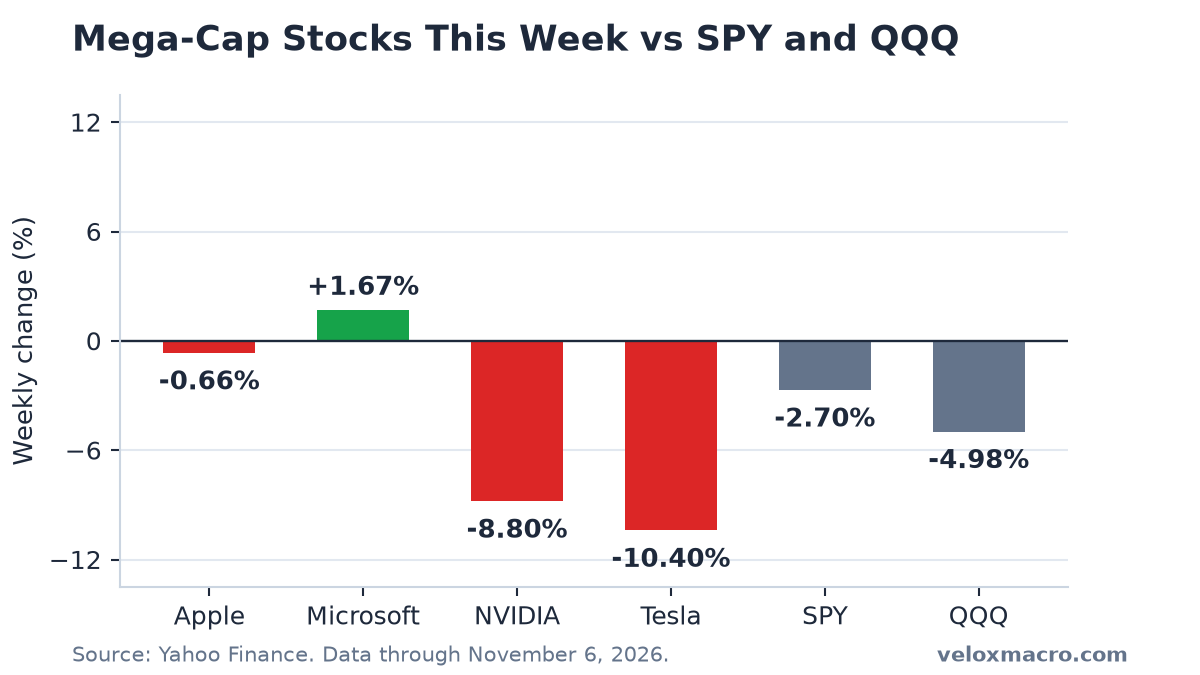
Tesla and NVIDIA lagged SPY by a wide margin. Apple and Microsoft both beat it on the week.
- Tesla fell 10.40% to 358.22. Thursday alone was −10.77%, to 343.69. Friday’s 4.23% bounce did not repair the week.
- NVIDIA fell 8.80% to 186.64. Thursday was −9.26%, to 181.60. The close is about 22% below the October 6 high of 239.24.
- Apple fell 0.66% to 342.37. Wednesday’s 349.51 was a record. Thursday and Friday gave most of that back.
- Microsoft rose 1.67% to 530.61. Wednesday’s 555.80 was a record. Thursday’s 3.58% drop and Friday’s further decline left the week still positive because the Wednesday gain was large.
Our mega-cap guide keeps the week-by-week scorecard for these four names.
The VIX Spiked to 28.18, Then Settled at 25.64
The VIX started the week at 19.42. It rose to 21.15 on Monday, eased to 16.61 on Wednesday, then jumped 69.66% on Thursday to 28.18. That was the highest close since March 30 and the first close above 25 since April 7. Friday brought it down 9.01% to 25.64. The week is still up 32.03%.
Over the 10 sessions through Friday, SPY’s realized volatility was about 27% annualized. QQQ’s was about 42%. Those readings are far above the quiet stretch in early October. A VIX still above 25 after Friday’s bounce means index protection has not cheapened back to the mid-teens.
Jobs Came In Firm; CPI Did Not Update
The October employment report, released Friday morning, showed nonfarm payrolls up 165,000 and unemployment down to 4.1% from 4.2%. August and September payrolls were revised higher, to +186,000 and +60,000 on the current vintage. The fuller write-up is in the November 5 CPI and jobs analysis.
September CPI remains the latest inflation reading, about 3.7% year over year, with core near 2.6%. October CPI is still ahead. The effective fed funds rate is 3.88% after the October 28 hold.
Yields Softened, Oil Fell Sharply, Mortgages Eased
The 10-year yield finished Friday near 4.86%, down about 7 basis points on the week from 4.93%. FRED’s official series was 4.84% on Thursday. The 2-year yield was 4.46% on Thursday, about 58 basis points above the funds rate and down from 4.56% on October 30. The post-decision decline in short yields continued.
WTI fell 12.76% on the week to $90.83. Monday’s drop under $100 and Wednesday’s $88.12 low did most of the damage. Oil near $90 is a different backdrop for the next headline CPI print than oil near $104 two weeks ago.
Freddie Mac’s November 5 survey put the 30-year mortgage rate at 7.18%, down from 7.24% the week before. The dollar index rose 0.41% to 102.30.
What to Watch
- Whether the VIX stays above 25. Thursday’s 28.18 was the spike. Friday’s 25.64 is still elevated. A move back under 20 would look like a one-day panic. Another close near 28 would not.
- October CPI. Due in mid-November. Jobs are firmer than they looked in September. Inflation is the missing half. Dates are on the economic calendar.
- QQQ versus the October 6 record. It still needs about 16% to get back to 759.66. NVIDIA at 22% below its high is a large part of that gap.
- December 9. The next Fed decision includes a new Summary of Economic Projections.
This is not financial advice.