Hotter Inflation, Softer Yields
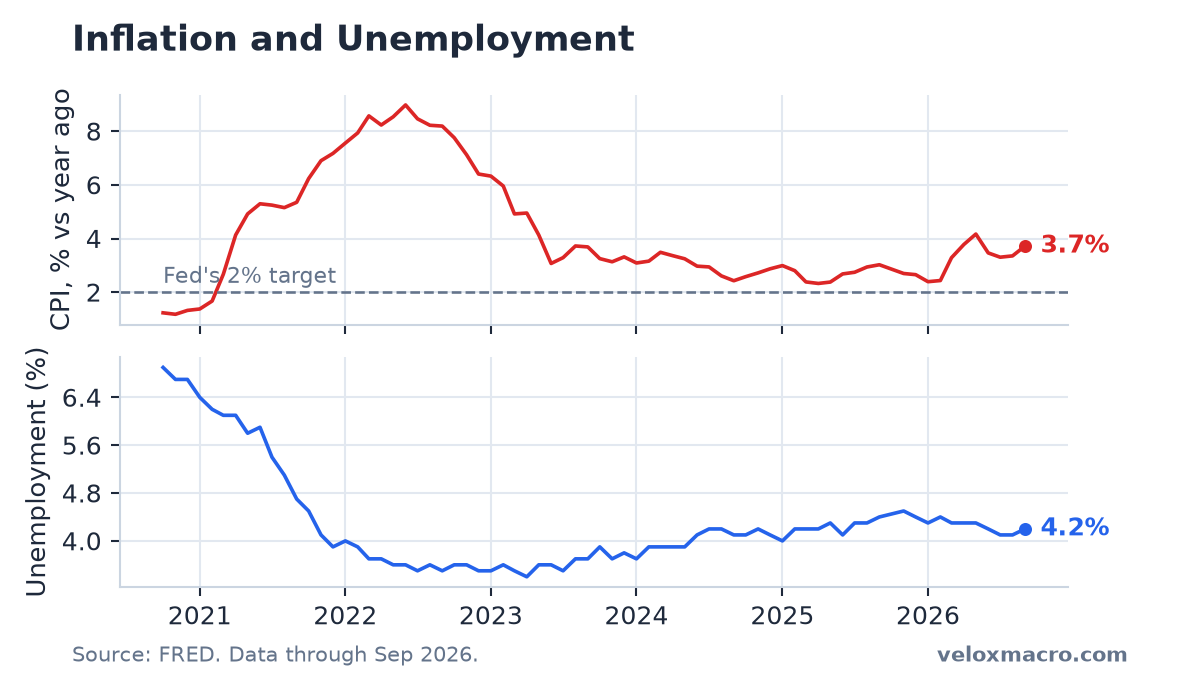
September consumer prices rose 3.7% from a year earlier, up from 3.4% in August and the highest annual pace since May. Core inflation, which leaves out food and energy, also edged higher, to 2.6% from 2.5%. On Thursday, October 15, the session after the report, SPY rose 0.28% to 771.79 while the 10-year yield fell about 10 basis points to 5.09%, its lowest close since late September. NVIDIA dropped another 1.84% to 217.23.
New to CPI and jobs data? Start with our guide to CPI, the unemployment rate, and our weekly archive.
Key Market Data (session close: October 15, 2026)
The tables below reflect the Thursday, October 15, 2026 U.S. close. Weekly changes run from the October 8 close. The September CPI report was released on Wednesday, October 14. Unemployment and payrolls are the September readings already in the data. The effective fed funds rate is the daily FRED series (DFF), not the monthly average.
| Ticker | Close | Daily % Change | Weekly % Change |
|---|---|---|---|
| SPY | 771.79 | +0.28% | -0.28% |
| QQQ | 728.00 | -0.13% | -2.62% |
| AAPL | 342.00 | -0.28% | +0.46% |
| MSFT | 539.44 | +1.08% | +3.22% |
| NVDA | 217.23 | -1.84% | -5.75% |
| TSLA | 362.44 | -1.29% | -3.35% |
| Indicator | Latest Value | As Of | Notes |
|---|---|---|---|
| CPI Index (CPIAUCSL) | 336.298 | 2026-09-01 | September; +0.65% m/m, 3.7% y/y |
| Core CPI (CPILFESL) | 338.896 | 2026-09-01 | Ex food and energy; +0.33% m/m, 2.6% y/y |
| Unemployment Rate (UNRATE) | 4.2% | 2026-09-01 | Up from 4.1% in August |
| Nonfarm Payrolls (PAYEMS) | +29K | 2026-09-01 | September gain; August was +133K |
| Effective Fed Funds Rate (DFF) | 3.88% | 2026-10-14 | Up from 3.63% since September 17 |
| 10-Year Treasury Yield (^TNX) | 5.09% | 2026-10-15 | Daily -1.95%; weekly -2.71% |
| 10-Year Treasury (FRED DGS10) | 5.19% | 2026-10-14 | Official daily series, one session behind ^TNX |
| VIX Index (^VIX) | 16.46 | 2026-10-15 | Daily -2.43%; weekly +6.81% |
| US Dollar Index (DX-Y.NYB) | 102.00 | 2026-10-15 | Daily -0.54%; weekly -0.14% |
| WTI Crude Oil (CL=F) | $97.97 | 2026-10-15 | Daily +3.03%; weekly +7.08% |
September CPI: The Cooling Streak Broke
The CPI index rose from 334.131 in August to 336.298 in September, a 0.65% month-over-month gain. That is the largest monthly rise since March. On a year-over-year basis the rate moved from 3.4% to 3.7%.
That ends a three-month stretch in which annual inflation had drifted lower after peaking at 4.2% in May. June was 3.5%, July 3.3%, August 3.4%. September put the rate back near where it was in April (3.8%). The Federal Reserve’s long-run target is 2%, so the gap widened again.
Core CPI, which excludes food and energy, rose 0.33% on the month and 2.6% from a year earlier, up from 2.5% in August. Core is the piece Fed officials watch more closely when they decide whether inflation is settling. It is still well below the headline rate, but it stopped easing.
Oil helps explain why the headline moved more than the core. WTI closed Thursday at $97.97, up 3.03% on the day and 7.08% on the week. Energy prices feed into the headline basket quickly. They do not show up in core CPI, which is why the two measures can diverge for a month or two.
Jobs: Still Soft, Not Collapsing
The September employment report was already out before this week’s CPI. Unemployment rose to 4.2% from 4.1% in August. Nonfarm payrolls rose only 29,000, after a 133,000 gain in August and a 10,000 decline in July. Hiring has been uneven for months rather than steadily strong.
That combination, hotter inflation with a softer labor market, is the awkward case for the Fed. It does not match a clean “overheating” story, and it does not match a clean “softening enough to cut” story either. The effective fed funds rate remains 3.88% after the quarter-point increase on September 17.
What the Market Did Around the Report
Wednesday, October 14, the release day, was the sharper session. SPY fell from 778.01 to 769.60, QQQ from 743.57 to 728.95, and the VIX jumped from 15.27 to 16.87. NVIDIA lost more than 3%. Thursday was a partial bounce for the broad market: SPY gained 0.28%, Microsoft rose 1.08%, and the VIX eased to 16.46. QQQ stayed soft at −0.13%, and NVIDIA fell another 1.84% to 217.23, about 9% below its October 6 record close of 239.24.
The more surprising move was in bonds. The 10-year yield fell from 5.22% on Tuesday to 5.19% on Wednesday and 5.09% on Thursday. Hotter inflation usually pushes long yields up. This time the yield kept falling even after the print. One reading is that investors shifted into Treasuries as equities sold off. Another is that the market is looking through one month of data toward the October 27–28 Fed meeting. The numbers alone cannot choose between those explanations. They only show that stocks and yields moved together in a risk-off pattern rather than the classic “hot CPI, higher yields” pattern.
The 10-year breakeven inflation rate, which shows what bond investors expect over the next decade, was 2.35% on October 14 and 2.32% on October 15. That is still close to where it has been all month and far below the 3.7% CPI print. Markets are treating September’s jump as mostly temporary, or at least not as a lasting rise in expected inflation.
How to Read the Two Mandates Together
The Fed’s dual mandate is price stability and maximum employment. Price stability means inflation near 2% over time. Maximum employment means the highest job level the economy can sustain without driving inflation back up.
Right now the price side looks worse than it did a month ago, and the jobs side looks soft but not broken. That mix usually argues for caution on rate cuts and leaves the door open to another hike if the next few prints stay hot. It is not, by itself, a forecast of what the Fed will do on October 28. It is the backdrop the committee will be looking at.
- High inflation, soft jobs: Harder for the Fed than a clean overheating story. Policy stays data-dependent.
- Headline vs core: Headline moved more because of energy. Core’s smaller rise still matters more for the medium-term path.
- One month is not a trend: May’s 4.2% peak was followed by cooler prints. September could reverse again if oil settles.
What to Watch
- October CPI. The next report is due in mid-November. Another print near 3.7% or higher would make September look less like a one-month bounce. Dates are on our economic calendar.
- The Fed meeting on October 27–28. There is no new Summary of Economic Projections at this meeting. The statement and the Chair’s press conference are the main signals.
- Oil near $100. WTI at $97.97 keeps pressure on the headline CPI. A further rise would show up again in October’s report.
- Payrolls and the unemployment rate. Another month near +30,000 jobs with unemployment at 4.2% or higher would keep the labor side soft while inflation is hot.
This is not financial advice.