A Hike in September, Then a Split Set of Numbers
The Federal Reserve meets on October 27 and 28 and announces its decision at 2:00 p.m. ET on October 28. It raised the target range by a quarter point on September 16, to 3.75%–4.00%. The effective fed funds rate moved from 3.63% to 3.88% the next day and has stayed there. The data since that meeting pull in two directions: September inflation sped up to 3.7%, and September hiring was soft. The 2-year Treasury yield, the market’s running read on the policy path, is lower than it was at the start of October and still well above today’s funds rate.
This note uses data through the October 23 close. It describes the backdrop. It does not call the decision.
| Item | Latest | As Of | Compared With |
|---|---|---|---|
| Effective fed funds rate (DFF) | 3.88% | 2026-10-22 | 3.63% before the September 16 hike |
| CPI inflation | 3.7% y/y | September 2026 | 3.4% in August |
| Core CPI | 2.6% y/y | September 2026 | 2.5% in August |
| Unemployment | 4.2% | September 2026 | 4.1% in August |
| Nonfarm payrolls | +29,000 | September 2026 | +133,000 in August |
| 2-year Treasury (DGS2) | 4.65% | 2026-10-22 | 4.84% on October 5 |
| 10-year Treasury (^TNX) | 4.99% | 2026-10-23 | 5.31% on October 5 |
| 10-year real yield (DFII10) | 2.64% | 2026-10-22 | 2.95% on October 5 |
What the Fed Changed in September
Through the first seven months of 2026 the Fed held the target range at 3.50%–3.75%. The September 16 decision was the first change of the year, a 25 basis point increase. The effective rate has been 3.88% since September 17. There is no new Summary of Economic Projections at the October meeting, so there is no new “dot plot.” The next projections are due with the December 8–9 meeting. October’s information is the statement and the Chair’s press conference at 2:30 p.m. ET.
Inflation Moved the Wrong Way
September CPI rose 3.7% from a year earlier, up from 3.4% in August and the highest annual pace since May’s 4.2%. The index itself went from 334.131 to 336.298, a 0.65% monthly gain. Core CPI, which leaves out food and energy, rose to 2.6% from 2.5%. The Fed’s long-run inflation goal is 2%, so both measures are still above it, and the headline rate moved farther away.
Oil is part of why the headline jumped more than the core. WTI closed Friday, October 23, at $103.27. Energy shows up in headline CPI quickly and stays out of the core rate. A 3.7% headline with a 2.6% core is a hotter report than August, with a lot of the extra heat in the parts the Fed often treats as less persistent. Both numbers are in the packet for this meeting. We walked through the print in the September CPI analysis.
Hiring Did Not Match the Inflation Print
September unemployment was 4.2%, up from 4.1% in August. Nonfarm payrolls rose 29,000, after a 133,000 gain in August and a 10,000 decline in July. That is not a collapse, and it is not a tight-labor-market boom. The employment side of the mandate looks softer than it did in midsummer, in the same month the inflation side got worse.
That mix is awkward for a committee that just raised rates. Another hike would lean on the inflation print. A hold would lean on the jobs print and on the idea that September prices were one month, with energy doing much of the work. The statement is where that balance shows up: which development it describes first, and whether it still calls inflation elevated.
What Bonds Have Done Since the Last Hike
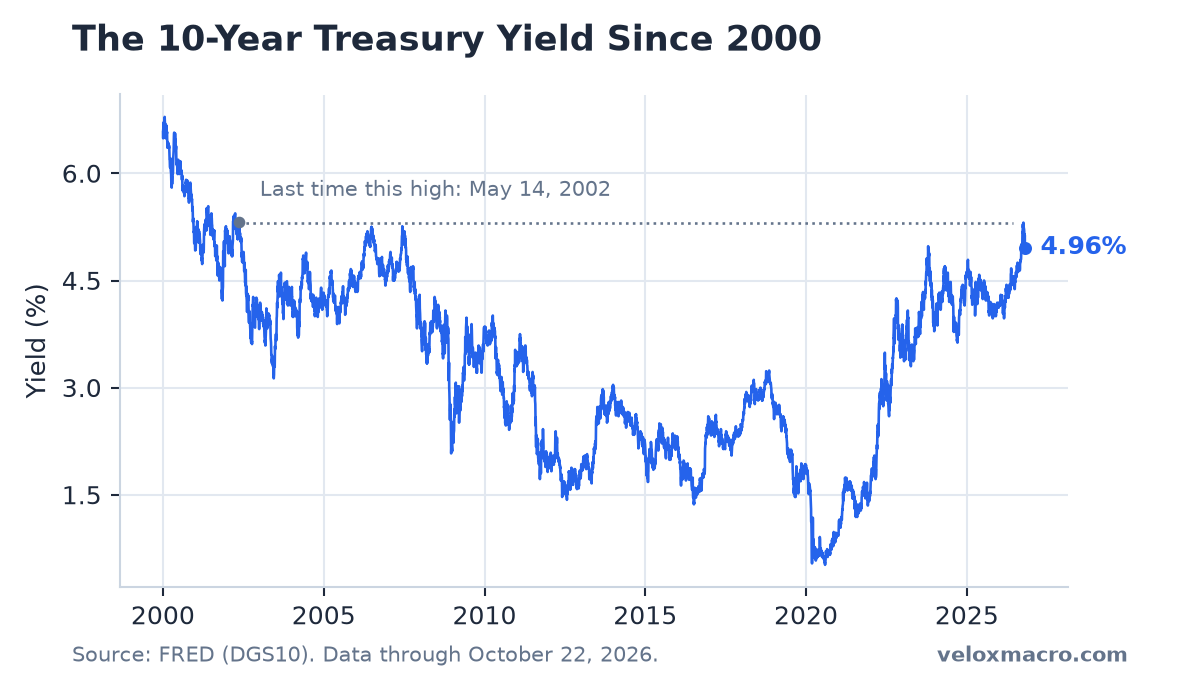
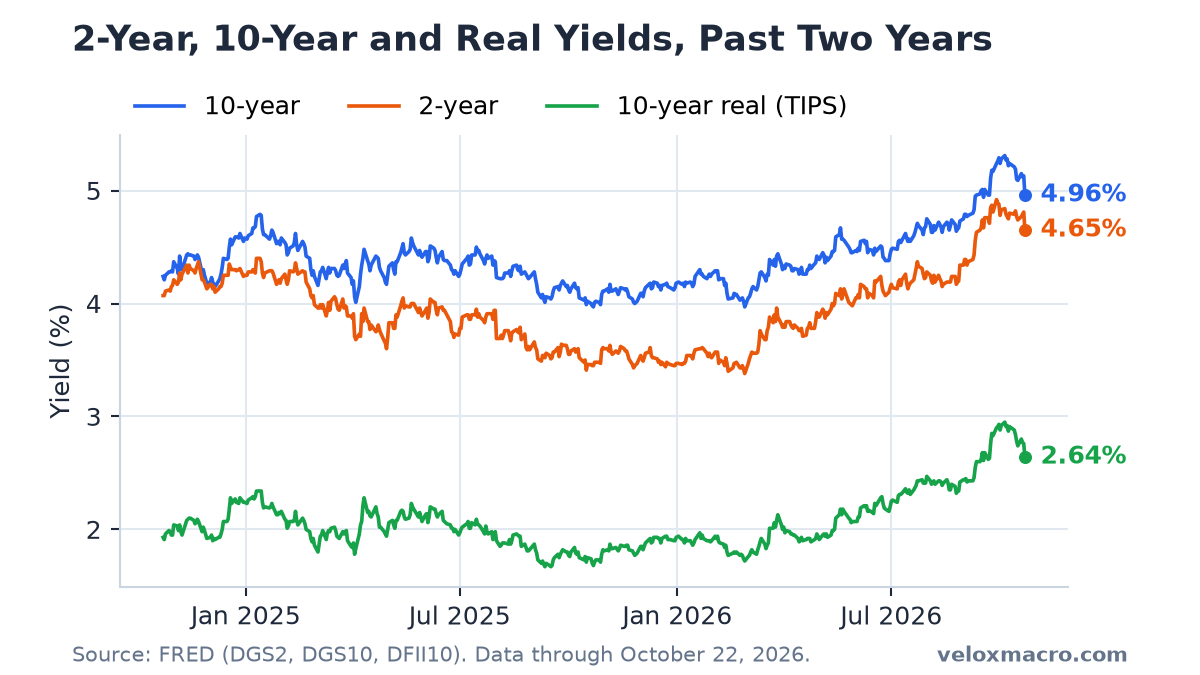
The 10-year yield closed at 5.31% on October 5, the highest since May 2002, and at about 4.99% on October 23. The drop of about 32 basis points came mostly from the real yield, not from investors marking down long-term inflation. FRED’s 10-year real yield was 2.95% on October 5 and 2.64% on October 22. The 10-year breakeven inflation rate was 2.36% at the peak and 2.34% on October 23. September’s hotter CPI did not lift the bond market’s decade-ahead inflation expectation.
The 2-year yield is the cleaner gauge of the policy path, because it is more sensitive to where the funds rate is expected to sit over the next two years. It was 4.84% on October 5 and 4.65% on October 22. That is 19 basis points lower, and it is still about 77 basis points above the 3.88% effective funds rate. A lower 2-year means investors have marked the path down a bit since the yield peak. A 2-year that far above the current funds rate means they still see short-term rates staying above today’s level on average over two years. It does not, by itself, say whether October 28 is a hike or a hold. A quarter-point change is small next to a two-year average.
Thursday, October 22, was the sharp session. The market 10-year fell about 20 basis points to 4.95%, and FRED’s official series fell from 5.13% to 4.96%. The 2-year fell from 4.81% to 4.65% the same day. Stocks fell with yields: SPY lost about 1.2% and QQQ about 2.9%. The week’s full scorecard is in the week ending October 23 report.
How to Read Wednesday Afternoon
Three things in the release are worth separating.
- The decision. The target range is 3.75%–4.00% now. A hike would take it to 4.00%–4.25%. A hold would leave it where September put it. Either one is a choice between the hotter CPI and the softer jobs report, not a verdict that one of those prints was wrong.
- The wording. With no new projections, the statement and the press conference carry the signal. Language that stresses the 3.7% inflation rate points one way. Language that stresses uneven hiring and a 4.2% unemployment rate points the other way.
- The 2-year yield after 2:00 p.m. If the decision surprises investors, the 2-year typically moves more than the 10-year in the first hour. The 10-year also includes the real-yield and term-premium moves that have dominated this autumn. Those can swamp a single meeting.
Freddie Mac’s 30-year mortgage rate was 7.32% on October 22, down from 7.40% the week before. Mortgage rates follow the 10-year with a lag, so the meeting matters for borrowers mainly through what it does to that longer yield. Dates and times are on our economic calendar, and the longer history of this yield backup is in the 10-year guide.
What to Watch
- A 2-year yield that keeps falling. A move further below 4.65% would mean investors are marking down the path of short rates, whatever the statement says.
- A breakeven rate that finally rises. It has stayed near 2.3% through the jump to 3.7% CPI. A sustained move higher would mean the inflation scare has spread beyond one month of data.
- October CPI, due in mid-November. Another print near 3.7% or higher would make September look less like an energy bounce. A cooler print would do the opposite.
- The December 8–9 meeting. That one includes new projections. October’s decision is a single step. December is when officials put a path next to it.
This is not financial advice.