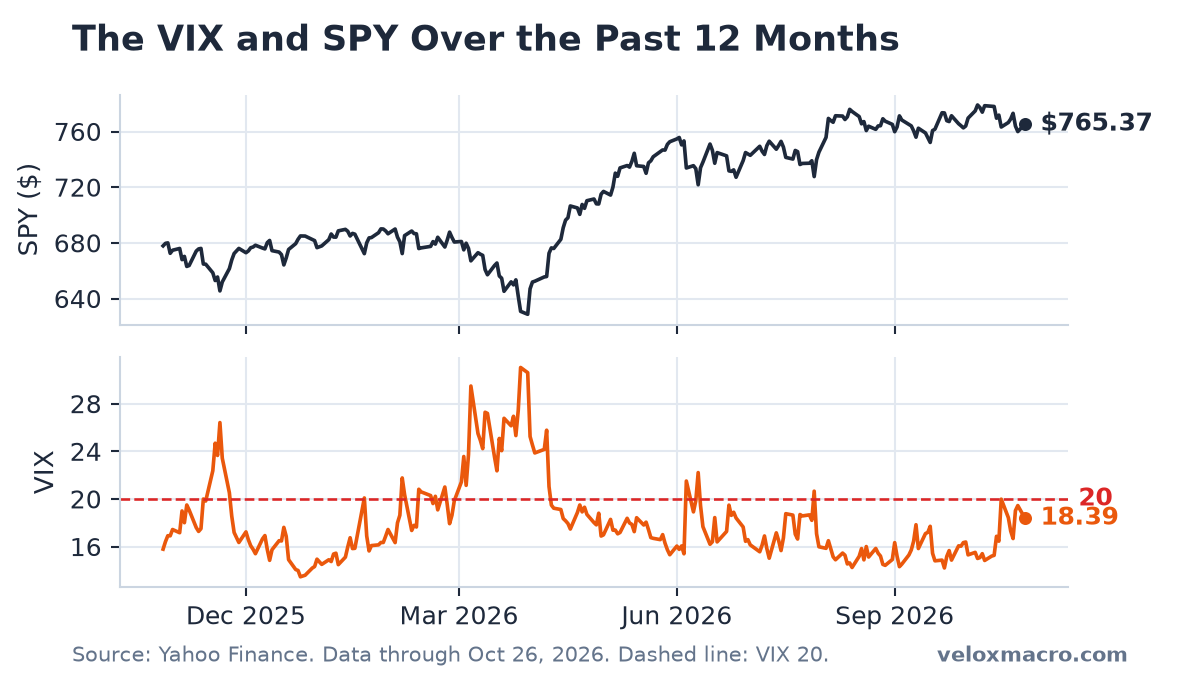
A Bounce That Leaves the VIX Near 18
Stocks rose on Monday, October 26, and the VIX fell with them. SPY gained 0.71% to 765.37 and QQQ gained 1.11% to 712.20. The VIX dropped 5.45% to 18.39. That is a real one-day decline from Friday’s 19.45, and it is still about 3.5 points above the 14.84 close on October 9. Tesla did most of the lifting, up 5.21%.
New to the VIX? Start with our complete VIX guide and weekly archive.
Key Market Data (session close: October 26, 2026)
The tables below reflect the Monday, October 26, 2026 U.S. close. Weekly changes run from the October 19 close. This analysis was published on October 28 and uses only data available at Monday’s close, before the Federal Reserve’s decision.
| Ticker | Close | Daily % Change | Weekly % Change |
|---|---|---|---|
| SPY | 765.37 | +0.71% | -0.14% |
| QQQ | 712.20 | +1.11% | -0.86% |
| AAPL | 343.91 | -1.10% | +0.28% |
| MSFT | 532.60 | +1.54% | -0.17% |
| NVDA | 216.00 | +2.39% | -0.50% |
| TSLA | 391.62 | +5.21% | +6.40% |
| Indicator | Latest Value | As Of | Notes |
|---|---|---|---|
| VIX Index (^VIX) | 18.39 | 2026-10-26 | Daily -5.45%; weekly -0.27% |
| 10-Year Treasury Yield (^TNX) | 4.99% | 2026-10-26 | Unchanged on the day; about -15 bp on the week |
| 10-Year Treasury (FRED DGS10) | 5.00% | 2026-10-23 | Official daily series, one session behind ^TNX |
| US Dollar Index (DX-Y.NYB) | 101.96 | 2026-10-26 | Daily +0.15%; weekly -0.02% |
| WTI Crude Oil (CL=F) | $101.76 | 2026-10-26 | Daily -1.46%; weekly -1.83% |
| Effective Fed Funds Rate (DFF) | 3.88% | 2026-10-23 | Up from 3.63% since September 17 |
| Unemployment Rate (UNRATE) | 4.2% | 2026-09-01 | September reading |
| CPI Index (CPIAUCSL) | 336.298 | 2026-09-01 | September index, about 3.7% above a year earlier |
Down on the Day, Flat Over the Week
Friday’s VIX close was 19.45. Monday’s was 18.39. SPY and the VIX moved in opposite directions, which is the usual pattern. The weekly change is the more useful comparison. From the October 19 close of 18.44, the VIX is down only 0.27%. In between it fell to 16.68 on October 21, jumped to 19.03 on October 22 and 19.45 on October 23, then eased on Monday.
A reading of 18.39 sits in the upper part of the 15-to-20 band. It is below the 20 line that usually marks elevated stress, and it is far from this year’s high of 31.05 on March 27. It is also nowhere near the mid-teens that held from October 5 through October 13. One down day did not put it back there.
Tesla Carried the Bounce
QQQ’s 1.11% gain recovered part of Friday’s flat close after Thursday’s drop, and it is still about 6.2% below the October 6 record of 759.66. SPY at 765.37 is about 1.8% below its October 6 record of 779.09. Over the five sessions since October 19, SPY is down 0.14% and QQQ is down 0.86%. Monday improved the day. It did not repair the week.
Tesla rose 5.21% to 391.62 and is up 6.40% from the October 19 close. NVIDIA gained 2.39% to 216.00 and is still about 9.7% below its October 6 record. Microsoft rose 1.54%. Apple fell 1.10% to 343.91, about 1.2% under the record close it set on October 22. The index rose because a few large stocks rose a lot, not because the whole market returned to its early-October highs.
18.39 Against a Louder Tape
Over the 10 sessions through Monday, SPY’s realized volatility was about 11.8% annualized. Two weeks ago, with the VIX near 15, that same measure was about 7%. The index has been moving more. QQQ’s 10-session realized volatility was about 24%, above the VIX, because the VIX prices S&P 500 options rather than Nasdaq-100 options. The growth sleeve has been the volatile part.
A VIX of 18.39 against roughly 12% realized volatility in SPY still means index protection costs more than SPY’s own recent moves. The gap is smaller than it was in the quiet stretch at the start of October. It is a premium on top of a market that has already had two closes near 20 this month.
What 18.39 Means for SPY
Dividing the VIX by the square root of 12 gives a rough one-month range. 18.39 becomes about 5.3%, or roughly $41 either way on SPY’s close of $765.37. For one day, divide by the square root of 252. That is about 1.2%, or around $9.
Monday’s 0.71% gain sat inside that daily figure. These ranges are a way to read the level. They are not a forecast.
Yields, Oil, and Wednesday’s Decision
The 10-year yield finished near 4.99%, effectively unchanged on the day and about 15 basis points below the October 19 close. It is still under the 5% line it broke on October 22, and about 32 basis points below the October 5 high of 5.31%. WTI slipped 1.46% to $101.76 and remains above $100. The effective fed funds rate is 3.88%.
The Fed’s decision is due at 2:00 p.m. ET on Wednesday, October 28, with the Chair’s press conference at 2:30 p.m. There is no new Summary of Economic Projections at this meeting. How the 2-year yield and the VIX react that afternoon will say more than Monday’s close can. The backdrop going in is in What the Data Says Ahead of the October 28 Fed Decision. Release times are on the economic calendar.
What to Watch
- The VIX after the decision. A move back toward 20 would mean Monday’s drop was one session. A move toward 16 would look more like the October 21 low.
- Whether the bounce spreads past Tesla. Monday’s 5.21% gain in Tesla was larger than the move in SPY. A second day led by one stock is a different story from a broad recovery.
- The 10-year around 5%. Monday left it at 4.99%. The decision can move it faster than the VIX does.
- QQQ versus the October 6 record. It still needs about 6.7% to get back to 759.66.
This is not financial advice.