Higher Through Wednesday, Then a Friday Drop
SPY lost 0.56% in the week to October 30 and QQQ lost 1.97%. Friday was a 1.77% drop for SPY and a 3.47% drop for QQQ. The Federal Reserve held the funds rate at 3.75% to 4% on October 28.
Weekly changes run from the October 23 close to the October 30 close.
Weekly Market Data (week ending October 30, 2026)
The stock table leads with the weekly change; Friday’s daily change is there for context. Macro rows use each indicator’s own as-of date. CPI and unemployment are still the September prints. This analysis was published on November 2 and uses only data available at Friday, October 30’s close.
| Ticker | Week-Ending Close (USD) | Weekly % Change | Friday Daily % |
|---|---|---|---|
| SPY | 755.72 | -0.56% | -1.77% |
| QQQ | 690.49 | -1.97% | -3.47% |
| AAPL | 344.63 | -0.89% | -1.23% |
| MSFT | 521.91 | -0.50% | -1.55% |
| NVDA | 204.64 | -3.00% | -4.22% |
| TSLA | 399.81 | +7.41% | -0.87% |
| Indicator | Latest Value | As Of | Weekly % Change |
|---|---|---|---|
| 10-Year Treasury Yield (^TNX) | 4.93% | 2026-10-30 | -1.18% |
| 10-Year Treasury (FRED DGS10) | 4.98% | 2026-10-29 | — |
| 2-Year Treasury (FRED DGS2) | 4.61% | 2026-10-29 | — |
| VIX (CBOE Volatility Index) | 19.42 | 2026-10-30 | -0.15% |
| US Dollar Index (DX-Y.NYB) | 101.88 | 2026-10-30 | +0.07% |
| WTI Crude Oil (CL=F) | $104.12 | 2026-10-30 | +0.82% |
| 30-Year Mortgage Rate (MORTGAGE30US) | 7.24% | 2026-10-29 | — |
| Effective Fed Funds Rate (DFF) | 3.88% | 2026-10-29 | — |
| Unemployment Rate (UNRATE) | 4.2% | 2026-09-01 | — |
| CPI Index (CPIAUCSL) | 336.298 | 2026-09-01 | — |
SPY vs QQQ: Friday Undid the Week
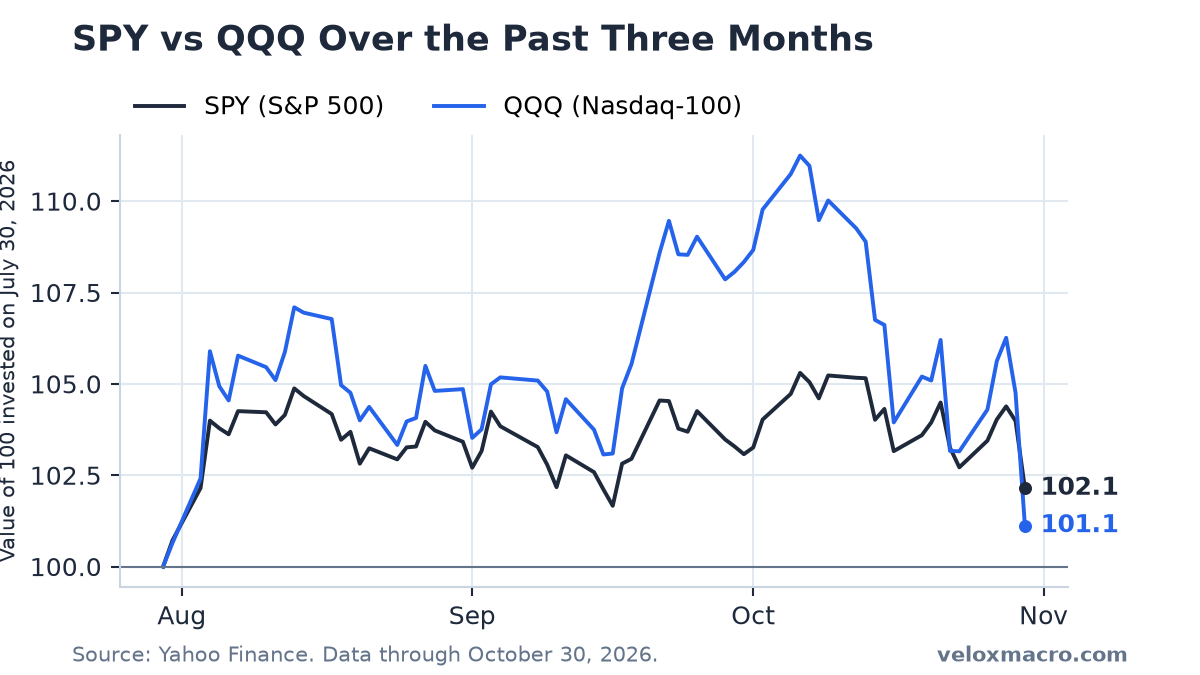
Both funds were higher through Wednesday, the day of the Fed decision. SPY rose from the prior Friday’s 759.97 to 772.31, about 1.6%. QQQ rose from 704.40 to 725.61, about 3.0%. Thursday was a step down, not a collapse: SPY closed at 769.36 and QQQ at 715.34. Friday was the break. SPY fell 1.77% to 755.72. QQQ fell 3.47% to 690.49.
From Wednesday’s close to Friday’s, SPY lost about 2.1% and QQQ about 4.8%. That left the week at −0.56% for SPY and −1.97% for QQQ. The growth sleeve did worse, as it has in the other down weeks this month. SPY is 3.0% below its October 6 record of 779.09. QQQ is about 9.1% below its October 6 record of 759.66. Our SPY vs QQQ guide explains how to read a week when the Nasdaq-100 lags the S&P 500.
Mega-Caps: Apple’s Thursday High, Tesla Still Up
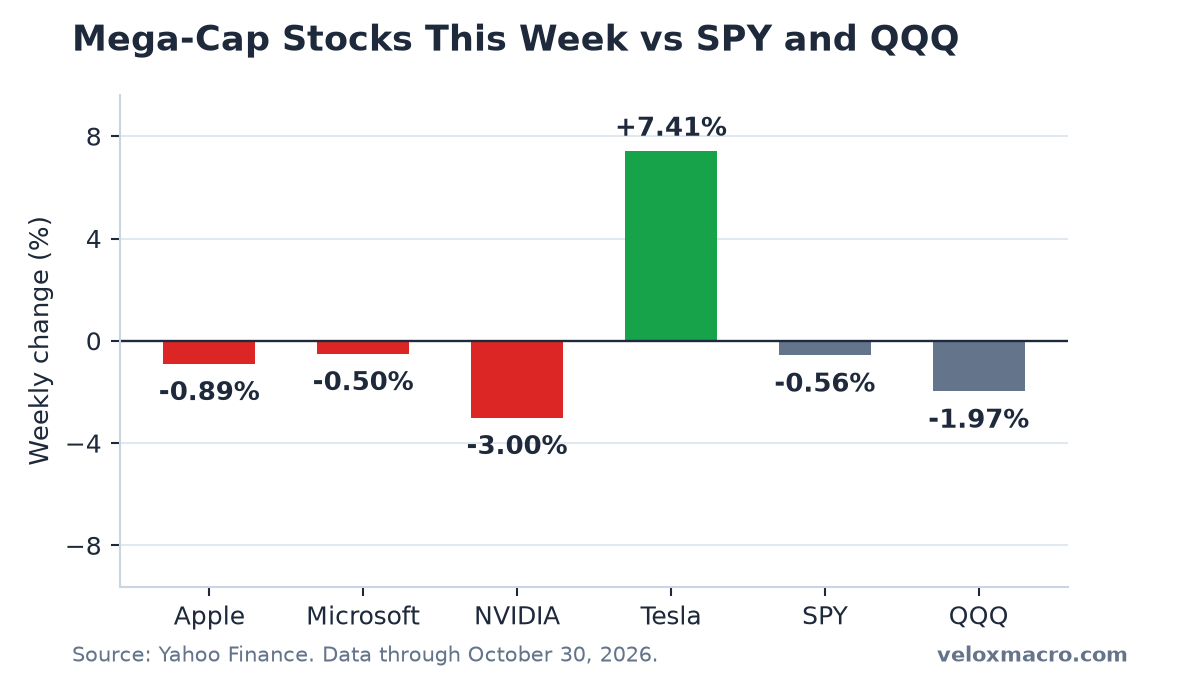
Tesla beat SPY by a wide margin. Microsoft was just ahead of it, down 0.50% against SPY’s 0.56%. Apple and NVIDIA lagged.
- Apple fell 0.89% to 344.63. Thursday’s close of 348.91 was above the October 22 high of 348.22. Friday gave that back, a 1.23% drop, and the week ended under both highs.
- Tesla rose 7.41% to 399.81. The gain was in by Tuesday, at 407.46. Wednesday through Friday faded about 1.9% of that and still left the week well ahead of the indexes.
- Microsoft fell 0.50% to 521.91, about 4.0% below its October 13 high of 543.45. Friday was a 1.55% decline.
- NVIDIA fell 3.00% to 204.64. Friday alone was −4.22%. The close is about 14.5% below the October 6 high of 239.24, and it is the main reason QQQ’s Friday drop was so much larger than SPY’s.
Our mega-cap guide keeps the week-by-week scorecard for these four names.
The Fed Held, and the 10-Year Finished at 4.93%
On October 28 the Federal Open Market Committee held the target range for the federal funds rate at 3.75% to 4%. The vote was 10 to 2. Lisa Cook and Beth Hammack preferred a quarter-point increase. The statement said inflation remains elevated. This meeting did not include a new Summary of Economic Projections. The setup going in is in What the Data Says Ahead of the October 28 Fed Decision.
The effective fed funds rate was still 3.88% on October 29, the same reading it has had since the September 17 step-up. A hold does not move that rate. The 2-year yield, which tracks the expected path of short rates, was 4.67% on October 28 and 4.61% on October 29. That is 8 basis points below the October 23 reading of 4.69%, and about 73 basis points above the 3.88% effective rate. The gap is smaller than it was at the start of the week. It is still a long way above today’s funds rate.
The 10-year did not stay under 5% all week. The market quote was 4.99% on Monday and Tuesday, 5.05% on Wednesday, 4.99% on Thursday and 4.93% on Friday. Wednesday was the first close back above 5% since October 21. Friday’s 4.93% is about 6 basis points under the prior Friday and about 38 basis points under the October 5 high of 5.31%. FRED’s official 10-year, through October 29, was 4.98%, down from 5.00% on October 23 and from 5.05% on the decision day.
The split of that official yield is still a real-yield story. The 10-year real yield was 2.63% on October 29, down from 2.66% on October 23 and from 2.95% on October 5. The breakeven inflation rate was 2.38% on October 28 and 2.34% on October 30, back where it was on October 23. Friday’s market quote of 4.93% does not yet have a matching real-yield print. The breakeven that is available for Friday did not jump.
Mortgages Fell to 7.24%, Oil Is Back Over $100
Freddie Mac’s October 29 survey put the average 30-year mortgage rate at 7.24%, down from 7.32% on October 22 and from 7.40% on October 8 and October 15. It is the lowest weekly average since the September 24 reading of 7.03%. The gap versus a 10-year near 4.9% is still a bit wider than 2 percentage points.
WTI rose 0.82% on the week to $104.12. Tuesday was the soft day, at $99.90, the only close under $100. Friday was the high of the week, up 2.08% on the day. A finish above $100 puts energy back in the conversation for the next CPI print. It does not change September’s reading.
The VIX fell from 19.45 to a Wednesday close of 16.91, then jumped 12.91% on Friday to 19.42. The week is almost unchanged, down 0.15%, because Friday put the index back where it started. The dollar index was flat, up 0.07% to 101.88. On Friday the 10-year yield fell as well, by about 6 basis points, to 4.93%.
Inflation and Jobs: Still the September Prints
September CPI remains the latest inflation reading, with the index at 336.298, about 3.7% above a year earlier. Unemployment is still September’s 4.2%. Neither series updated this week. The next jobs report is due November 6. October CPI is not out yet. We covered the September print in the October 15 CPI and jobs analysis. Release dates are on the economic calendar.
What to Watch
- The November 6 jobs report. September payrolls were a gain of 29,000 and unemployment was 4.2%. The 2-year yield at 4.61% is the rate that has been moving first when the policy outlook shifts.
- Whether Friday’s QQQ drop extends. The fund gave back a 3% midweek gain and more in two sessions. NVIDIA’s 4.22% Friday decline was the largest move among the four mega-caps.
- The 10-year around 4.93%. Wednesday closed back above 5%, at 5.05%. Friday closed at 4.93%. The real yield, not the breakeven rate, has done almost all of the work since the October 5 high.
- December 9. The next decision includes a new Summary of Economic Projections. This week’s meeting did not.
This is not financial advice.