A Hot Monthly Print, and Yields Back Above 5%
October consumer prices rose 0.4% from September. Core CPI, which leaves out food and energy, rose 0.3%. The Bureau of Labor Statistics did not publish year-over-year rates because October 2025 CPI was never collected. On Thursday, November 12, the 10-year yield finished at 5.10%, and SPY slipped 0.35% to 757.12.
New to CPI and jobs data? Start with our guide to CPI, the unemployment rate, and our weekly archive.
Key Market Data (session close: November 12, 2026)
The tables below reflect the Thursday, November 12, 2026 U.S. close. Weekly changes run from the November 5 close. The October CPI report was released Tuesday, November 10. Unemployment and payrolls are still the October readings. Wednesday, November 11, was Veterans Day: the stock market was open and the Treasury market was closed. This analysis was published on November 13 and uses only data available at Thursday’s close.
| Ticker | Close | Daily % Change | Weekly % Change |
|---|---|---|---|
| SPY | 757.12 | -0.35% | +3.29% |
| QQQ | 688.17 | -0.32% | +6.35% |
| AAPL | 354.88 | -0.14% | +3.19% |
| MSFT | 523.00 | +0.36% | -2.41% |
| NVDA | 166.19 | -4.34% | -8.49% |
| TSLA | 397.45 | +1.69% | +15.64% |
| Indicator | Latest Value | As Of | Notes |
|---|---|---|---|
| CPI Index (CPIAUCSL) | 337.476 | 2026-10-01 | October; +0.4% m/m; no official y/y |
| Core CPI (CPILFESL) | 339.900 | 2026-10-01 | Ex food and energy; +0.3% m/m |
| Unemployment Rate (UNRATE) | 4.1% | 2026-10-01 | Down from 4.2% in September |
| Nonfarm Payrolls (PAYEMS) | +165K | 2026-10-01 | October gain; September revised to +60K |
| Effective Fed Funds Rate (DFF) | 3.88% | 2026-11-11 | Held after the October 28 decision |
| 10-Year Treasury Yield (^TNX) | 5.10% | 2026-11-12 | Daily +2.10%; weekly +5.50% |
| 10-Year Treasury (FRED DGS10) | 4.98% | 2026-11-10 | Official daily series; bond market closed Nov 11 |
| 2-Year Treasury (FRED DGS2) | 4.73% | 2026-11-10 | Most sensitive to expected Fed policy |
| 10-Year TIPS Real Yield (FRED DFII10) | 2.78% | 2026-11-10 | Yield after inflation |
| 10-Year Breakeven Inflation (FRED T10YIE) | 2.24% | 2026-11-12 | Inflation expected by bond investors |
| VIX Index (^VIX) | 18.70 | 2026-11-12 | Daily +6.92%; weekly -33.64% |
| US Dollar Index (DX-Y.NYB) | 103.17 | 2026-11-12 | Daily +0.25%; weekly +1.60% |
| WTI Crude Oil (CL=F) | $88.74 | 2026-11-12 | Daily +2.55%; weekly -1.97% |
| 30-Year Mortgage Rate (MORTGAGE30US) | 7.11% | 2026-11-12 | Freddie Mac weekly average |
October CPI: Third Straight Firm Month
The CPI index rose from 336.298 in September to 337.476 in October. On the Bureau of Labor Statistics release, that is a seasonally adjusted 0.4% month-over-month gain, after 0.6% in September. It is the third consecutive month of gains of 0.4% or more. Core CPI rose 0.3%, matching August and September.
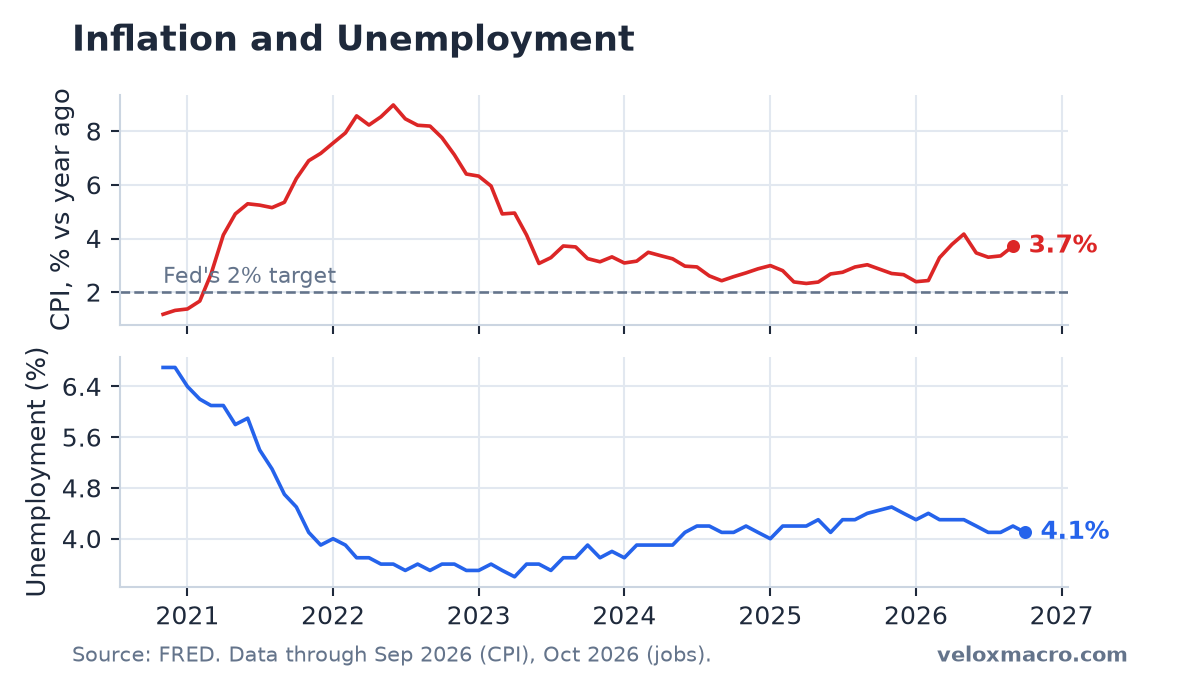
BLS did not publish year-over-year inflation rates for October. Last year’s federal government shutdown prevented collection of October 2025 CPI, so there is no official base month. FRED’s CPIAUCSL series also has no October 2025 observation. September’s year-over-year rate of about 3.7% remains the last official annual reading. We are not substituting an estimated year-over-year figure for the missing month.
Energy in the report rose 0.7% on the month, and food rose 0.5%. Those pieces help explain why the headline moved as much as it did. Core’s third straight 0.3% gain is the cleaner signal for the medium-term path, and it is still firmer than the roughly 0.2% monthly pace that would keep inflation near the Fed’s 2% goal over time.
Jobs: Still the October Package
October employment was already out before this CPI print. Unemployment is 4.1%, down from 4.2% in September. Nonfarm payrolls rose 165,000, with August and September revised higher on the current vintage. That write-up is in the November 5 CPI and jobs analysis.
The mix is firmer jobs and another firm monthly inflation reading, without an official annual inflation rate to compare with September’s 3.7%. The effective fed funds rate remains 3.88% after the October 28 hold.
What the Market Did Around the Report
Tuesday, November 10, the release day, took the 10-year yield from about 4.86% to 4.98%. SPY fell 0.37%, QQQ fell 0.68%, and NVIDIA dropped 5.47%. The VIX stayed under 20 at 19.46. Wednesday was a stock-market session on Veterans Day, with the Treasury market closed. SPY rose to 759.81, Apple closed at a record 355.63, and the market 10-year quote was near 5.00%. Thursday pushed the yield to 5.10%, the first close above 5% since October 28, while SPY slipped 0.35% to 757.12.
From Thursday a week earlier, when SPY closed at 733.00 and the VIX at 28.18, the equity week is a recovery: SPY up 3.29% and QQQ up 6.35%. Tesla is up 15.64% from that Thursday low. NVIDIA is still down 8.49% on the week and about 30.5% under its October 6 high. The VIX at 18.70 is 33.64% below last Thursday’s close.
FRED’s official 10-year was 4.98% on Tuesday. The 2-year was 4.73%, about 85 basis points above the 3.88% funds rate and up from 4.46% on November 5. The 10-year real yield was 2.78% on Tuesday, up from 2.60% on November 5. The breakeven inflation rate was 2.20% on Tuesday and 2.24% on Thursday, still far below any simple reading of recent monthly CPI strength. The CPI-day yields move is covered in the November 10 yields analysis.
Oil Softened, Mortgages Fell to 7.11%
WTI closed Thursday at $88.74, up 2.55% on the day but still well below the late-October closes above $100. Oil that soft does not erase October’s 0.4% CPI gain. It does change the backdrop for November’s headline print.
Freddie Mac’s November 12 survey put the 30-year mortgage rate at 7.11%, down from 7.18% the week before and the lowest weekly average since September 24. That decline came even as the 10-year yield moved back above 5%.
How to Read the Two Mandates Together
The Fed’s dual mandate is price stability and maximum employment. October jobs look firmer than the first September package did. October CPI’s monthly reading is firm again, and the missing year-over-year rate removes the usual annual benchmark. That is an awkward input for the December 9 meeting, which includes a new Summary of Economic Projections. It is the backdrop, not a forecast of the decision.
- Firm jobs, firm monthly CPI: Less support for an easy policy path than a soft-jobs, cooling-inflation mix would give.
- No official y/y: Do not treat estimated annual rates as BLS figures. September’s 3.7% is still the last official annual print.
- Core at 0.3% for a third month: Matters more for the medium-term inflation path than one month of energy.
What to Watch
- Whether the 10-year stays above 5%. Thursday’s 5.10% is the first close back above that line since the Fed decision. The 2-year at 4.73% is the nearer policy signal.
- November CPI. The next print will again have a usable year-over-year base. Dates are on the economic calendar.
- December 9. Projections return. October’s 0.4% monthly CPI rise and 4.1% unemployment are both in the book.
- NVIDIA versus the rebound. Indexes recovered from November 5 while NVIDIA kept making new lows for the move.
This is not financial advice.