Yields Rise on the Inflation Print
The 10-year Treasury yield finished Tuesday, November 10, at 4.98%, about 12 basis points above Monday’s 4.86% close. October CPI rose 0.4% on the month. SPY fell 0.37% and NVIDIA dropped 5.47%. The VIX eased further to 19.46.
New to Treasury yields? Start with our complete guide to the 10-year yield and weekly archive.
Key Market Data (session close: November 10, 2026)
The tables below reflect the Tuesday, November 10, 2026 U.S. close. Weekly changes run from the November 3 close. FRED’s daily Treasury series for Tuesday are published about one business day later, so the official 10-year row here is Monday’s print; the market quote is Tuesday’s. The October CPI report was released Tuesday morning. This analysis was published on November 13 and uses only data available at Tuesday’s close.
| Ticker | Close | Daily % Change | Weekly % Change |
|---|---|---|---|
| SPY | 749.92 | -0.37% | -0.59% |
| QQQ | 674.76 | -0.68% | -1.54% |
| AAPL | 348.25 | -0.62% | +5.00% |
| MSFT | 533.16 | -2.20% | +2.34% |
| NVDA | 168.89 | -5.47% | -18.29% |
| TSLA | 379.78 | +0.46% | -4.70% |
| Indicator | Latest Value | As Of | Notes |
|---|---|---|---|
| US 10-Year Treasury (^TNX) | 4.98% | 2026-11-10 | Daily +2.45%; weekly +0.63% |
| 10-Year Treasury (FRED DGS10) | 4.88% | 2026-11-09 | Official daily series |
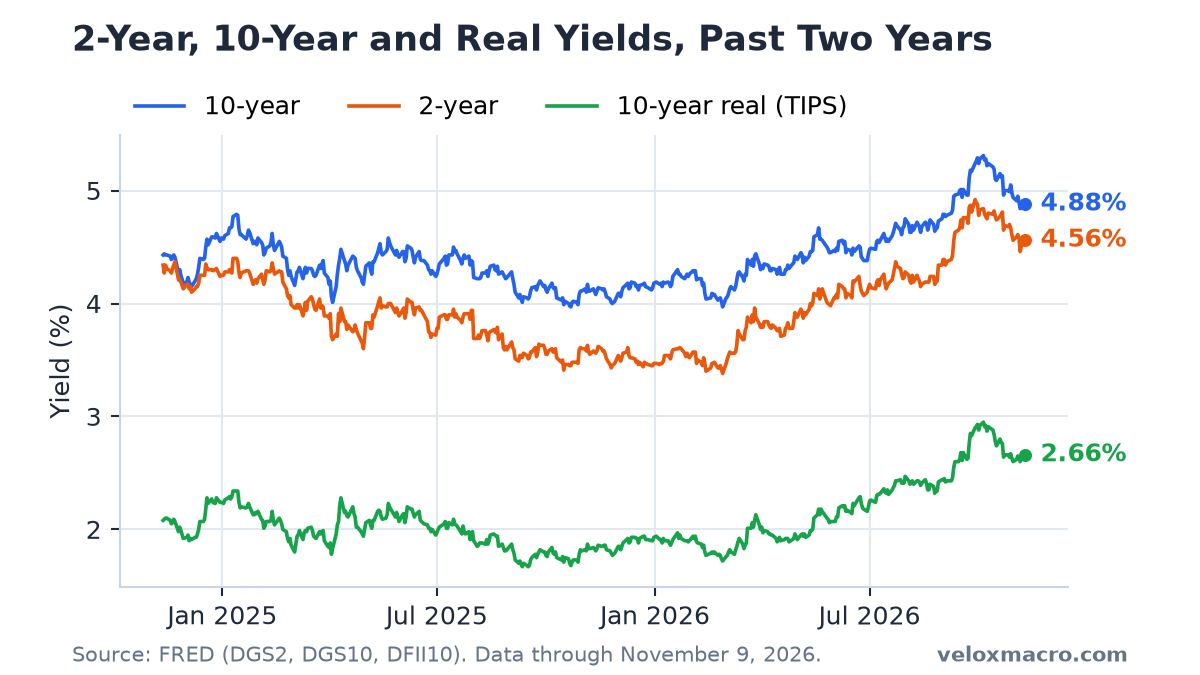
| 2-Year Treasury (FRED DGS2) | 4.56% | 2026-11-09 | Most sensitive to expected Fed policy |
| 10-Year TIPS Real Yield (FRED DFII10) | 2.66% | 2026-11-09 | Yield after inflation |
| 10-Year Breakeven Inflation (FRED T10YIE) | 2.20% | 2026-11-10 | Inflation expected by bond investors |
| CPI Index (CPIAUCSL) | 337.476 | 2026-10-01 | October; +0.4% m/m; no official y/y |
| Core CPI (CPILFESL) | 339.900 | 2026-10-01 | Ex food and energy; +0.3% m/m |
| 30-Year Mortgage Rate (MORTGAGE30US) | 7.18% | 2026-11-05 | Freddie Mac weekly average |
| Effective Fed Funds Rate (DFF) | 3.88% | 2026-11-09 | Held after the October 28 decision |
| VIX Index (^VIX) | 19.46 | 2026-11-10 | Daily -2.31%; weekly -6.58% |
| US Dollar Index (DX-Y.NYB) | 102.23 | 2026-11-10 | Daily +0.57%; weekly +0.35% |
| WTI Crude Oil (CL=F) | $86.04 | 2026-11-10 | Daily -0.93%; weekly -10.46% |
Back Near 5% After the Soft Patch
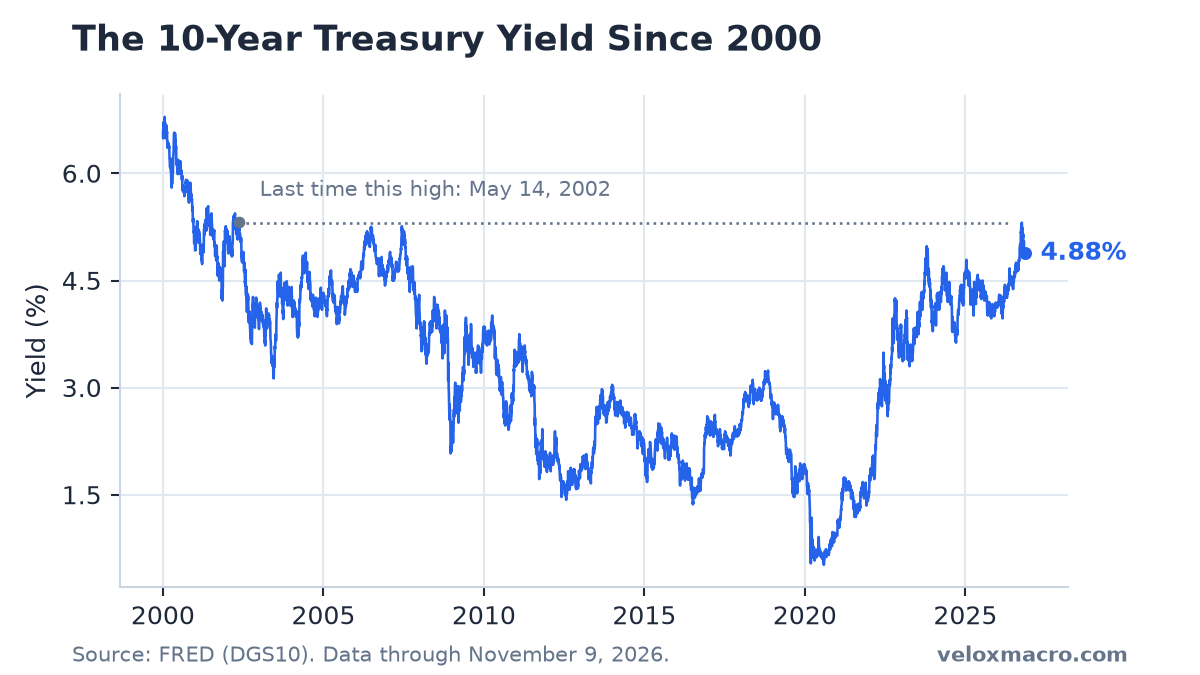
Tuesday’s 2.45% rise in ^TNX is about 12 basis points, from 4.86% to 4.98%. That is the highest market close since October 28, when the yield finished at 5.05% on the Fed decision day. From the November 3 close of 4.95%, the week is up about 3 basis points. From the October 5 high of 5.31%, the yield is still about 33 basis points lower.
FRED’s official 10-year was 4.88% on Monday. Tuesday’s official print comes a day later. The market move on the CPI morning was clear even before that print lands.
October CPI: Hot Month, No Official Year-Over-Year
The CPI index rose from 336.298 in September to 337.476 in October, a seasonally adjusted gain of 0.4% on the Bureau of Labor Statistics release. Core CPI, which leaves out food and energy, rose 0.3%, to 339.900. September’s monthly gains were 0.6% for the headline and 0.3% for core.
BLS did not publish year-over-year rates for October. October 2025 CPI was never collected during last year’s federal government shutdown, so there is no official base month. FRED’s index series also has no October 2025 observation. September’s year-over-year rate remains the last official annual reading, at about 3.7%. The fuller CPI write-up belongs with Thursday’s session in the Friday CPI post; Tuesday is the first market day with the print in hand.
Real Yields Did the Jump; Breakevens Did Not
Through Monday’s FRED prints, compared with the October 5 peak:
- 10-year yield: 5.31% to 4.88%, down 43 basis points.
- 10-year real yield: 2.95% to 2.66%, down 29 basis points.
- 10-year breakeven inflation: 2.36% to 2.22% on Monday and 2.20% on Tuesday, down about 16 basis points from the peak.
Tuesday’s market yield rose to 4.98% while the breakeven rate fell to 2.20%. That gap implies a real yield near 2.78% on the day, above Monday’s official 2.66% print. The backup on CPI day was a real-yield move, not a jump in expected long-run inflation. The longer account of the autumn climb is in Why the 10-Year Treasury Yield Hit Its Highest Level Since 2002.
The 2-Year Is Off Its Low
The 2-year yield was 4.56% on Monday, up from 4.46% on November 5 and still below the October 5 reading of 4.84%. It is about 68 basis points above the effective fed funds rate of 3.88%. A hotter monthly CPI print with no official year-over-year rate is awkward for the December 9 meeting, which includes a new Summary of Economic Projections. It is not, by itself, a forecast of the decision. The October hold is covered in What the Data Says Ahead of the October 28 Fed Decision.
Stocks Soft; NVIDIA Keeps Falling
SPY lost 0.37% to 749.92, about 3.7% under its October 6 record. QQQ lost 0.68% to 674.76, about 11.2% under its record. NVIDIA fell 5.47% to 168.89, about 29% under its October 6 high, and is down 18.29% from November 3. Microsoft fell 2.20%. Tesla rose 0.46%. The VIX fell another 2.31% to 19.46, a second day under 20 after Thursday’s 28.18 spike. Oil slipped to $86.04.
What to Watch
- Whether 4.98% holds above the post-Fed soft patch. A close back through 5.05% would erase the decline from the decision day. A fade under 4.90% would make Tuesday look like a one-day CPI reaction.
- The real yield near 2.66%. Tuesday’s market move higher with breakevens falling is the same pattern as the October climb: real yields, not inflation expectations, did the work.
- December 9. The next decision includes projections. October CPI’s 0.4% monthly rise is now in the data set the committee will have.
- NVIDIA near 30% below its high. The index bounce on Monday did not include it, and Tuesday made that worse. Times for the next releases are on the economic calendar.
This is not financial advice.