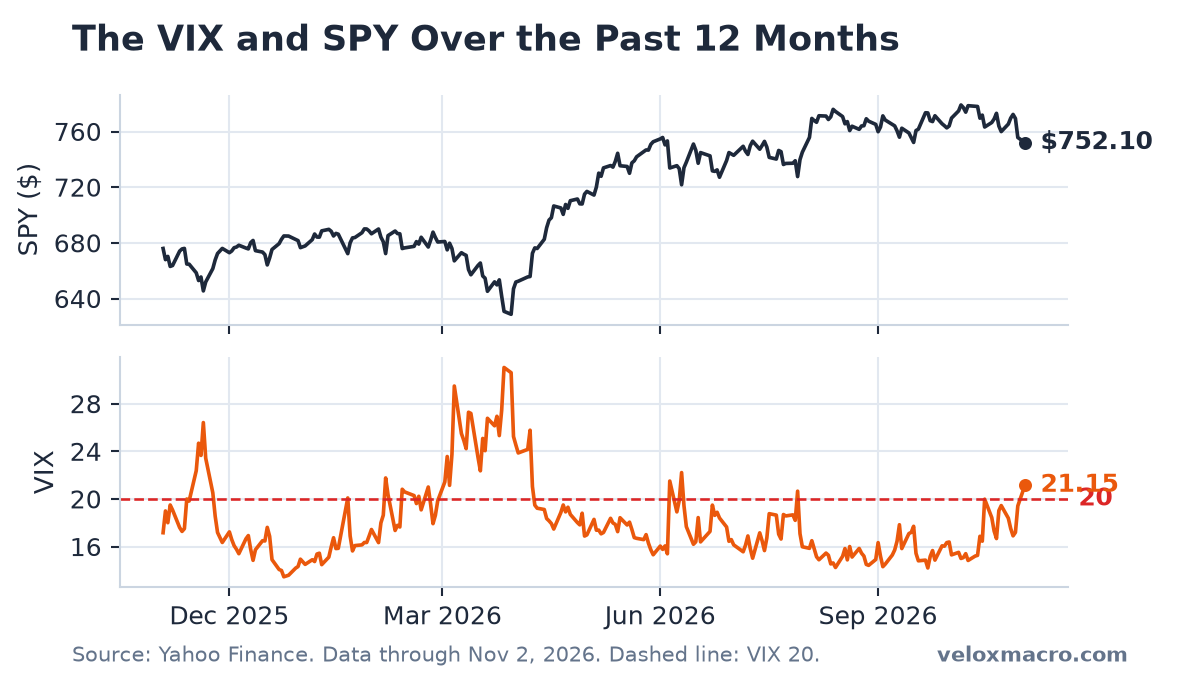
A Jump Above 20 After Friday’s Selloff
The VIX rose 8.91% on Monday, November 2, to 21.15. That is the first close above 20 since July 29. SPY fell 0.48% to 752.10 and QQQ fell 1.36% to 681.09. Oil dropped 7.36% to $96.46.
New to the VIX? Start with our complete VIX guide and weekly archive.
Key Market Data (session close: November 2, 2026)
The tables below reflect the Monday, November 2, 2026 U.S. close. Weekly changes run from the October 26 close. This analysis was published on November 4 and uses only data available at Monday’s close.
| Ticker | Close | Daily % Change | Weekly % Change |
|---|---|---|---|
| SPY | 752.10 | -0.48% | -1.73% |
| QQQ | 681.09 | -1.36% | -4.37% |
| AAPL | 338.32 | -1.83% | -1.63% |
| MSFT | 507.12 | -2.83% | -4.78% |
| NVDA | 202.06 | -1.26% | -6.45% |
| TSLA | 403.82 | +1.00% | +3.12% |
| Indicator | Latest Value | As Of | Notes |
|---|---|---|---|
| VIX Index (^VIX) | 21.15 | 2026-11-02 | Daily +8.91%; weekly +15.01% |
| 10-Year Treasury Yield (^TNX) | 4.89% | 2026-11-02 | Daily -0.71%; weekly -1.85% |
| 10-Year Treasury (FRED DGS10) | 4.94% | 2026-10-30 | Official daily series, one session behind ^TNX |
| US Dollar Index (DX-Y.NYB) | 101.75 | 2026-11-02 | Daily -0.13%; weekly -0.21% |
| WTI Crude Oil (CL=F) | $96.46 | 2026-11-02 | Daily -7.36%; weekly -5.21% |
| Effective Fed Funds Rate (DFF) | 3.88% | 2026-10-30 | Unchanged since September 17 |
| Unemployment Rate (UNRATE) | 4.2% | 2026-09-01 | September reading |
| CPI Index (CPIAUCSL) | 336.298 | 2026-09-01 | September index, about 3.7% above a year earlier |
Above 20 for the First Time Since July
Friday’s VIX close was 19.42. Monday’s was 21.15. The last close at or above 20 was July 29, at 20.66. October 16’s 19.99 was the previous high for the fall stretch, and it never crossed 20. Monday did.
From the October 26 close of 18.39, the VIX is up 15.01% on the week. In between it fell to 16.91 on October 28, the day the Fed held rates, then jumped to 19.42 on Friday and 21.15 on Monday. A reading of 21.15 is still well below this year’s high of 31.05 on March 27. It is the highest close since June 10.
Stocks Fell Again, Led by Microsoft and NVIDIA
SPY lost another 0.48% and is about 3.5% below its October 6 record of 779.09. QQQ lost 1.36% and is about 10.3% below its October 6 record of 759.66. Over the five sessions since October 26, SPY is down 1.73% and QQQ is down 4.37%. Monday extended Friday’s decline rather than reversing it.
Microsoft fell 2.83% to 507.12, about 6.7% under its October 13 high. NVIDIA fell 1.26% to 202.06, about 15.5% under its October 6 high. Apple fell 1.83% to 338.32, about 3.0% under the October 29 high of 348.91. Tesla rose 1.00% to 403.82 and is still up 3.12% from October 26. One gainer among the four mega-caps did not lift the indexes.
21.15 Against Rising Realized Volatility
Over the 10 sessions through Monday, SPY’s realized volatility was about 13.2% annualized. Two weeks ago that measure was near 12%. QQQ’s 10-session realized volatility was about 27%, well above the VIX, because the VIX prices S&P 500 options rather than Nasdaq-100 options. The growth sleeve remains the volatile part.
A VIX of 21.15 against roughly 13% realized volatility in SPY still means index protection costs more than SPY’s own recent moves. The premium is larger than it was when the VIX sat near 18 last week. Friday’s 3.47% drop in QQQ and Monday’s follow-through are what that premium is pricing.
What 21.15 Means for SPY
Dividing the VIX by the square root of 12 gives a rough one-month range. 21.15 becomes about 6.1%, or roughly $46 either way on SPY’s close of $752.10. For one day, divide by the square root of 252. That is about 1.3%, or around $10.
Monday’s 0.48% decline sat inside that daily figure. These ranges are a way to read the level. They are not a forecast.
Yields Fell, Oil Dropped Sharply
The 10-year yield finished near 4.89%, down on the day and about 10 basis points below the October 26 close near 4.99%. FRED’s official series through October 30, the latest print available at Monday’s close, was 4.94%. The effective fed funds rate is still 3.88% after the October 28 hold. WTI fell 7.36% to $96.46, from Friday’s $104.12. That is the largest one-day percentage move in at least three months, and it takes crude back under $100.
The next major U.S. print is the November 6 jobs report. September payrolls rose 29,000 and unemployment was 4.2%. Release times are on the economic calendar. The week that led into Monday is in the October 30 weekly report.
What to Watch
- Whether the VIX stays above 20. One close above 20 after months under it can reverse. A second close above 20 would make Monday look less like a one-day spike.
- QQQ versus SPY. The Nasdaq-100 is down about 10% from its October 6 high. SPY is down about 3.5%. That gap has been the story since mid-October.
- Oil after the $96.46 close. A move of that size can fade. It can also stay if the next sessions confirm it.
- The November 6 jobs report. The 2-year yield and the VIX are the first places a surprise usually shows up.
This is not financial advice.