Why the 10-Year Treasury Yield Hit Its Highest Level Since 2002
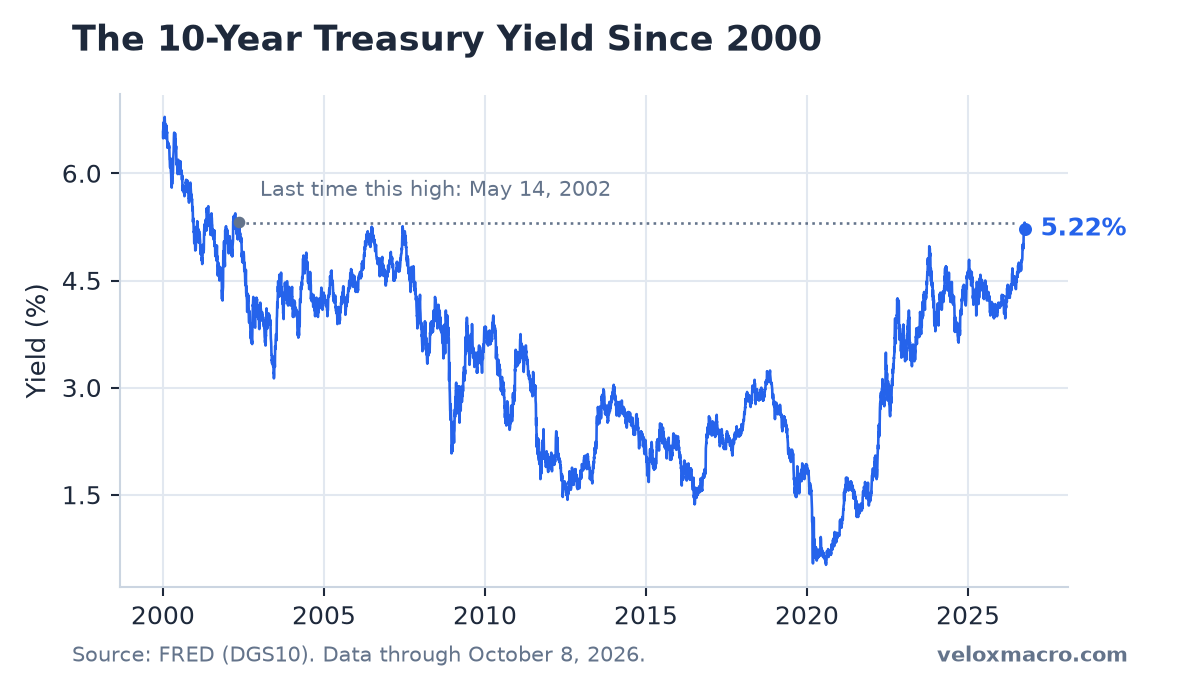
The 10-year Treasury yield closed at 5.31% on October 5, 2026, its highest close since May 2002. Almost all of this year’s rise came from real yields, not from higher inflation expectations.
That distinction matters. A yield that rises because investors fear inflation tells a different story from one that rises because investors want a bigger return after inflation. The data from FRED points clearly to the second. This article walks through how high 5.31% is in historical terms, how the move breaks down, and what it means for borrowers.
The Numbers at a Glance
| Measure | Latest | As Of | Context |
|---|---|---|---|
| 10-year Treasury yield (DGS10) | 5.22% | 2026-10-08 | Peak close of 5.31% on October 5 |
| 10-year real yield (DFII10) | 2.87% | 2026-10-08 | 2.95% on October 5, highest since November 2008 |
| 10-year breakeven inflation | 2.35% | 2026-10-08 | Between 2.18% and 2.50% all year |
| 2-year Treasury yield (DGS2) | 4.75% | 2026-10-08 | 3.47% at the end of 2025 |
| 10-year term premium (THREEFYTP10) | 1.08% | 2026-10-02 | Highest since April 2010 |
| 30-year mortgage rate (MORTGAGE30US) | 7.40% | 2026-10-08 | Highest since November 2023 |
| Effective fed funds rate (DFF) | 3.88% | 2026-10-08 | Raised from 3.63% on September 17 |
Breakeven inflation here is the 10-year yield minus the 10-year real yield. The term premium is a model estimate published by the Federal Reserve Board and carried on FRED.
How High Is 5.31%?
The last time the 10-year closed at or above 5.31% was May 14, 2002, when it finished at 5.32%. October’s peak is above the 2007 high of 5.26%, set in June of that year just before the financial crisis. It is also well above the October 2023 peak of 4.98%, which at the time was the highest since 2007.
The climb this year has been steep. The 10-year started 2026 at 4.18%, fell to its low for the year of 3.97% on February 27, and then rose about 134 basis points to the October 5 peak. Since then it has eased to 5.22%, but it remains far above where it began the year.
Real Yields Did Almost All the Work
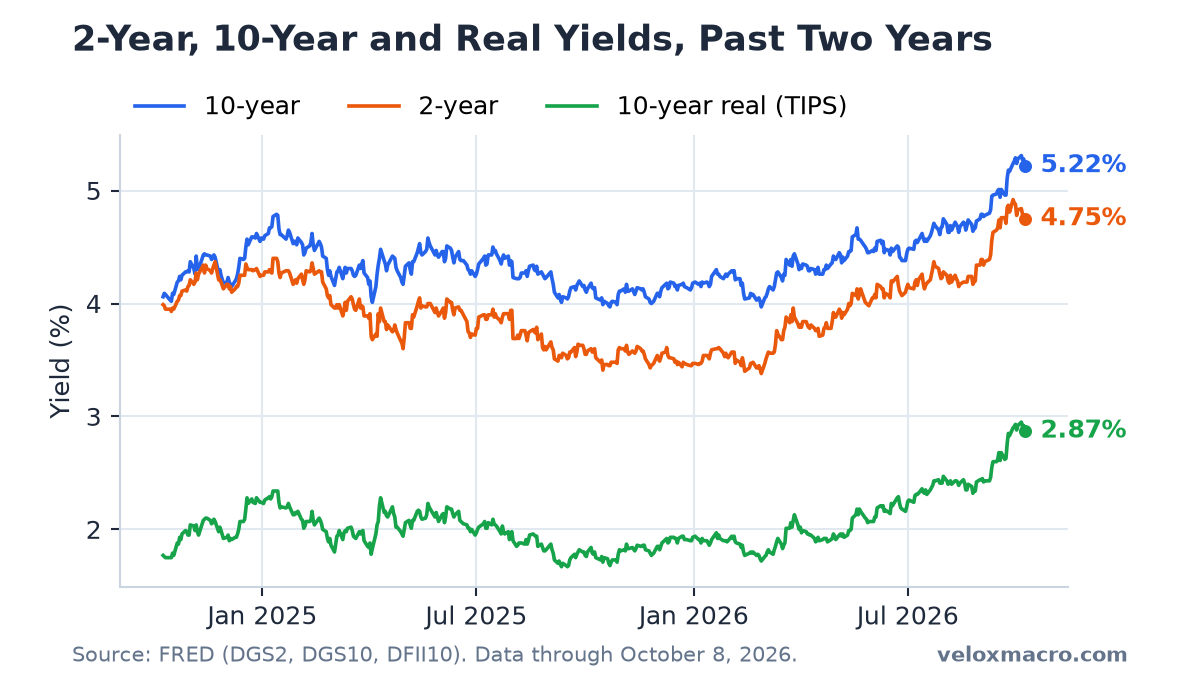
A nominal Treasury yield can be split into two parts: the real yield, which is the return investors demand after inflation, and breakeven inflation, which is roughly what the market expects inflation to average. Treasury Inflation-Protected Securities give a direct read on the first part.
| Measure | Dec 31, 2025 | Jun 30, 2026 | Oct 5, 2026 | Change since June 30 |
|---|---|---|---|---|
| 10-year yield | 4.18% | 4.44% | 5.31% | +87 bp |
| 10-year real yield | 1.93% | 2.20% | 2.95% | +75 bp |
| Breakeven inflation | 2.25% | 2.24% | 2.36% | +12 bp |
| 2-year yield | 3.47% | 4.14% | 4.84% | +70 bp |
| Term premium (Oct 2) | 0.57% | 0.70% | 1.08% | +38 bp |
Since the end of June, the 10-year rose 87 basis points, and 75 of them came from the real yield. Measured from the end of 2025, the split is even more lopsided: the 10-year gained 113 basis points and the real yield 102. Breakeven inflation moved only about 11 to 12 basis points in either period.
At 2.95% on October 5, the 10-year real yield was at its highest since November 2008. Investors are now asking for close to 3% a year above inflation to lend to the U.S. government for a decade.
Inflation Expectations Barely Moved
This is not because inflation has been quiet. Annual CPI inflation rose from about 2.4% in January to 4.2% in May, then eased to about 3.4% in August, the latest month available. That is well above the Fed’s 2% goal.
Yet breakeven inflation has stayed between 2.18% and 2.50% all year. The bond market appears to be treating this year’s inflation as something the Fed will deal with, not as the start of a lasting shift. If investors had lost faith in that, breakevens would be climbing, and they are not.
Two Forces Behind Higher Real Yields
The first is the expected path of the Fed’s own rate. The Fed cut six times between September 2024 and December 2025, taking the effective fed funds rate from 5.33% to about 3.63%, and then held it there for most of 2026. The 2-year yield, which tracks expectations for the policy rate, did not wait for the Fed. It rose from 3.47% at the end of 2025 to 4.74% on September 16, the day before the Fed raised its rate to 3.88%. Markets priced in tighter policy months before it arrived.
The second is the term premium, the extra yield investors demand for tying money up in a long bond rather than rolling over short ones. The Fed Board’s estimate rose from 0.57% at the end of 2025 to 1.08% on October 2, the highest since April 2010. A higher term premium usually reflects more uncertainty about the path of rates and inflation, or a larger supply of bonds to absorb. The data does not say which of those dominates, but it shows that investors want more compensation for holding duration.
The two forces showed up at different times. In the first half of the year the 2-year rose faster than the 10-year, and the gap between them narrowed from 0.71 to 0.30 percentage points. Since June the 10-year has risen faster, and the gap has widened to about 0.47. That pattern fits a market that first repriced the Fed and then began charging more for long-term risk.
What It Means for Borrowers
Mortgage rates follow the 10-year more closely than the Fed’s rate. Freddie Mac’s 30-year fixed rate averaged 7.40% in the week of October 8, up from a 2026 low of 5.98% in late February and the highest since November 2023. On a $400,000 loan, the difference between those two rates is roughly $380 a month in principal and interest.
Companies face the same arithmetic when they refinance debt, and higher real yields make bonds a more serious alternative to stocks. So far the stock market has absorbed it: SPY set a record close on October 6, a day after the 10-year peaked. Our 10-year Treasury yield guide tracks the weekly readings behind this move.
What to Watch
- September CPI on October 14. A hot reading that also lifts breakeven inflation would mean the bond market’s view of inflation is starting to change.
- Breakeven inflation near 2.5%. That is the top of this year’s range. A break above it would turn a real-yield story into an inflation story.
- The 2-year yield. If it keeps falling, as it did this week, markets are scaling back expectations for further Fed increases.
- The term premium. It is updated with a lag, but a move back below 1% would suggest the demand for extra compensation is fading.
This is not financial advice.