SPY Hits a Record as the 10-Year Backs Off 5.31%
This is the weekly U.S. macro report for the week ending Friday, October 9, 2026. Weekly changes run from the October 2 close to the October 9 close.
The week’s main facts: the 10-year Treasury yield closed at 5.31% on Monday, its highest close since May 2002, then eased to finish near 5.24%, down about 3 basis points on the week. SPY rose 1.16% and set a record close of 779.09 on Tuesday. QQQ also set records on Monday and Tuesday but gave most of that back on Thursday and ended up only 0.23%. There was no new jobs or CPI data this week, and the fed funds rate held at 3.88%.
Weekly Market Data (week ending October 9, 2026)
The stock table leads with the weekly change; Friday’s daily change is there for context. Macro rows use each indicator’s own as-of date. CPI and unemployment are monthly FRED series and trail market prices by weeks.
| Ticker | Week-Ending Close (USD) | Weekly % Change | Friday Daily % |
|---|---|---|---|
| SPY | 778.57 | +1.16% | +0.60% |
| QQQ | 751.27 | +0.23% | +0.49% |
| AAPL | 336.64 | +0.88% | -1.11% |
| MSFT | 535.07 | +3.39% | +2.38% |
| NVDA | 229.28 | -2.00% | -0.52% |
| TSLA | 382.70 | +3.27% | +2.05% |
| Indicator | Latest Value | As Of | Weekly % Change |
|---|---|---|---|
| 10-Year Treasury Yield (^TNX) | 5.24% | 2026-10-09 | -0.63% |
| 10-Year Treasury (FRED DGS10) | 5.22% | 2026-10-08 | — |
| VIX (CBOE Volatility Index) | 14.84 | 2026-10-09 | -3.07% |
| US Dollar Index (DX-Y.NYB) | 102.21 | 2026-10-09 | +0.27% |
| WTI Crude Oil (CL=F) | $91.85 | 2026-10-09 | +0.81% |
| Effective Fed Funds Rate (DFF) | 3.88% | 2026-10-08 | — |
| Unemployment Rate (UNRATE) | 4.2% | 2026-09-01 | — |
| CPI Index (CPIAUCSL) | 334.131 | 2026-08-01 | — |
SPY vs QQQ: The Leader Switched
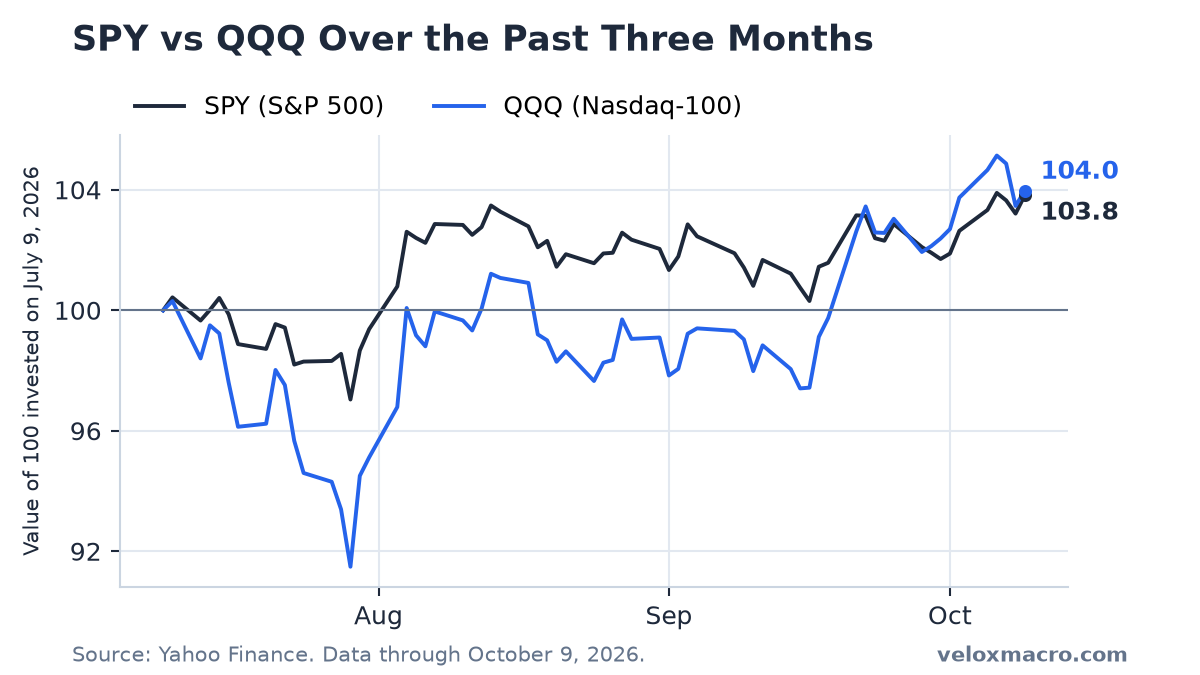
Last week QQQ beat SPY by about 0.9 percentage points. This week it went the other way: SPY gained 1.16% and QQQ 0.23%, a gap of about 0.93 points in SPY’s favor.
For three days the two moved together. Both rose on Monday and Tuesday, and both closed at records on Tuesday: SPY at 779.09, just above its August 13 high of 777.88, and QQQ at 759.66. Both slipped slightly on Wednesday. Thursday was where they split. QQQ fell 1.34% while SPY fell only 0.42%. On Friday both bounced, SPY by 0.60% and QQQ by 0.49%.
That leaves SPY 0.07% below its record and QQQ 1.10% below its own. When the broad index holds up better than the Nasdaq-100 on a down day, the selling is usually concentrated in large technology stocks rather than spread across the market. Our SPY vs QQQ guide explains how to read that kind of gap and keeps a week-by-week record of it.
Mega-Caps: Microsoft Up, NVIDIA Down
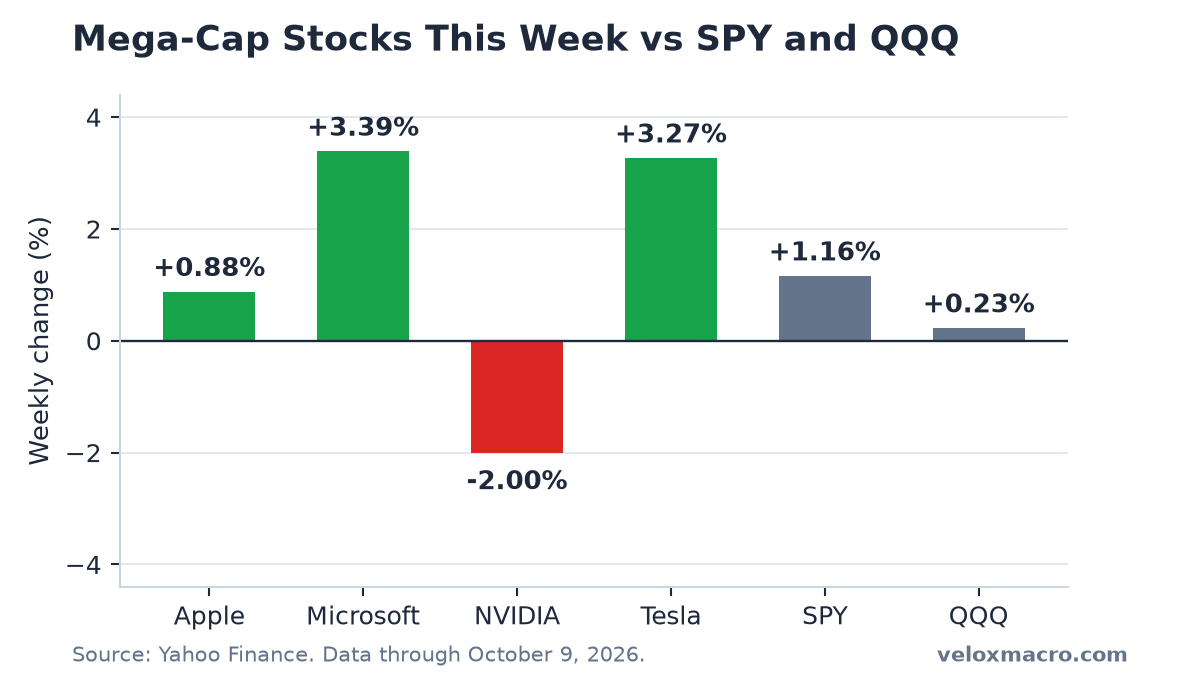
Two of the four mega-caps we track beat SPY this week, and the other two lagged it.
- Microsoft gained 3.39%, the best of the group. Most of it came on Friday, when it rose 2.38% to 535.07, its highest close since late October 2025.
- Tesla rose 3.27% to 382.70, its highest close since mid-July.
- Apple added 0.88%. It was up more than 2% for the week after Thursday, then fell 1.11% on Friday.
- NVIDIA fell 2.00%. It closed at records on Monday and Tuesday, peaking at 239.24, then dropped 2.94% on Thursday and finished 4.2% below that high.
NVIDIA’s Thursday drop, together with a 1.35% decline in Microsoft the same day, goes a long way toward explaining why QQQ fell so much harder than SPY on Thursday, since both carry far more weight in QQQ. Our mega-cap guide tracks these four names each week and shows how to judge moves like this against trading volume.
Rates: A Peak on Monday, Then a Pullback
The 10-year yield opened the week by closing at 5.31% on Monday, the highest since May 2002. It did not hold there. FRED’s daily series shows 5.27% on Tuesday, 5.28% on Wednesday and 5.22% on Thursday, and the market quote ended Friday near 5.24%. After rising about 18 and then 9 basis points in the previous two weeks, the 10-year slipped about 3 basis points this week.
Shorter yields fell more. The 2-year Treasury, which tracks expectations for the Fed’s own rate more closely, dropped from 4.83% to 4.75% between the October 2 and October 8 readings. The 10-year inflation-indexed yield fell from 2.92% to 2.87% over the same days, almost the same move as the regular 10-year. Inflation expectations built into bond prices therefore barely changed. Real borrowing costs did most of the moving.
Mortgage rates have not caught up with the pullback. Freddie Mac’s weekly survey put the 30-year fixed rate at 7.40% on October 8, up from 7.28% a week earlier and the highest since November 2023. The survey mostly reflects rates from earlier in the week, when the 10-year was at its peak.
The Fed and the Jobs Data
The effective fed funds rate stayed at 3.88% every day this week, inside the 3.75%–4.00% target range set in September. No Fed decision was scheduled.
No new jobs data came out this week either. The latest unemployment rate is still September’s 4.2%, released on October 2 and covered in last week’s report. The next jobs report is scheduled for November 6.
Inflation: September CPI Is Next
The latest CPI reading in FRED is still August, with the index at 334.131, about 3.4% above a year earlier. The September report is scheduled for Wednesday, October 14. It is the first inflation reading since the Fed’s September rate increase. It also comes while the 10-year sits just below a 24-year high, so a hotter number would land on a bond market that has already priced in a lot.
Oil, the Dollar and the VIX
WTI crude rose 0.81% to $91.85. That small weekly figure hides a wide range: oil fell to $88.28 on Wednesday, then jumped about 3.6% on Thursday. The dollar index rose 0.27% to 102.21 and stayed between about 101.8 and 102.3 all week, even as U.S. yields eased.
The VIX barely reacted to Thursday’s tech selloff. It rose from 15.08 to 15.41 that day, then fell to 14.84 on Friday, down 3.07% for the week. That suggests investors saw Thursday’s selling as limited to a few large names, not as a reason to buy protection across the market.
What to Watch
- September CPI on October 14. A reading above August’s 3.4% annual pace would put pressure back on yields.
- The 10-year against 5.31%. A close above Monday’s level would be a new high for this move. A drop below this week’s 5.22% would extend the pullback.
- QQQ and NVIDIA versus their Tuesday records. QQQ needs about 1.1% and NVIDIA about 4.3% to get back there. SPY is within 0.1% of its record.
- Mortgage rates. If the 10-year stays below 5.3%, the next weekly mortgage survey should show whether the 7.40% reading was the peak.
This is not financial advice.