A Flat Index With Busy Stocks Underneath
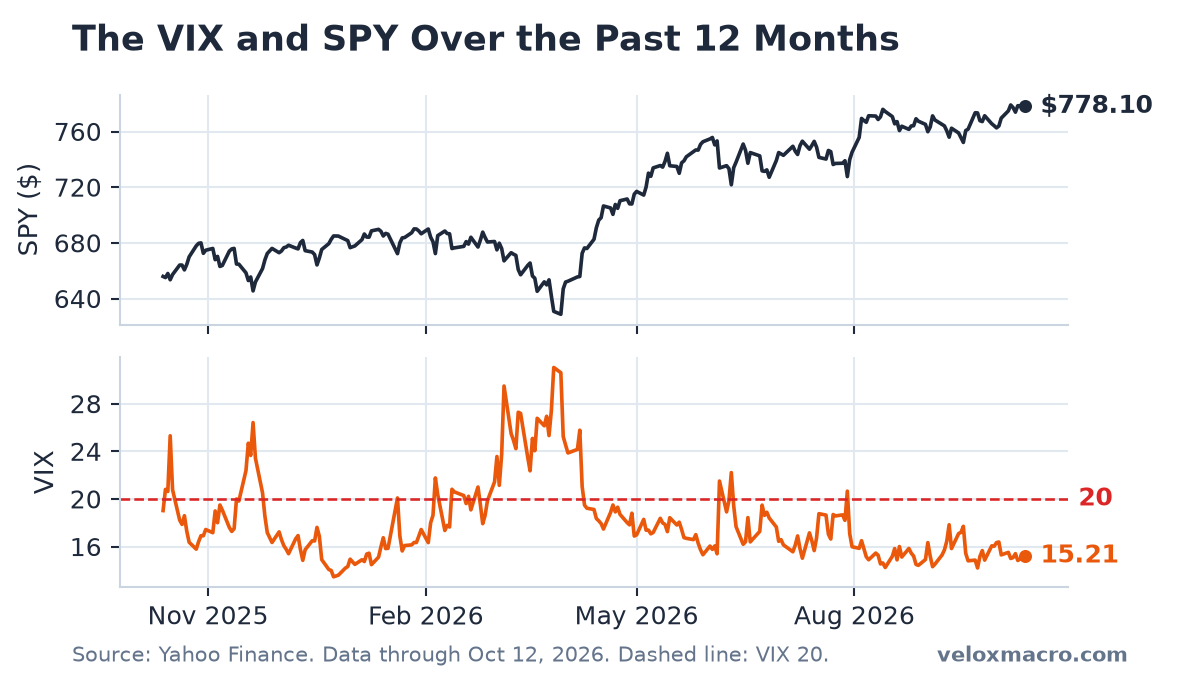
The S&P 500 barely moved on Monday, October 12. SPY slipped 0.06% to 778.10, just 0.13% below its October 6 record. The largest stocks did not sit still: Apple rose 1.29% and Microsoft 1.14%, while NVIDIA fell 1.29% and Tesla 1.22%. The VIX rose 2.49% to 15.21, still inside the narrow range it has held since October 5.
New to the VIX? Start with our complete VIX guide and weekly archive.
Key Market Data (session close: October 12, 2026)
The tables below reflect the Monday, October 12, 2026 U.S. close. Weekly changes run from the October 5 close. Monday was Columbus Day: stock and options markets were open, but the U.S. bond market was closed, so the 10-year yield is effectively Friday’s level. This analysis was published on October 15 and uses only data that was available at Monday’s close.
| Ticker | Close | Daily % Change | Weekly % Change |
|---|---|---|---|
| SPY | 778.10 | -0.06% | +0.42% |
| QQQ | 746.04 | -0.70% | -1.34% |
| AAPL | 340.97 | +1.29% | +2.43% |
| MSFT | 541.15 | +1.14% | +3.04% |
| NVDA | 226.32 | -1.29% | -5.27% |
| TSLA | 378.03 | -1.22% | -0.18% |
| Indicator | Latest Value | As Of | Notes |
|---|---|---|---|
| VIX Index (^VIX) | 15.21 | 2026-10-12 | Daily +2.49%; weekly -2.00% |
| 10-Year Treasury Yield (^TNX) | 5.24% | 2026-10-12 | Bond market closed for Columbus Day; weekly -1.34% |
| 10-Year Treasury (FRED DGS10) | 5.22% | 2026-10-08 | Latest official reading published before Monday’s close |
| US Dollar Index (DX-Y.NYB) | 102.58 | 2026-10-12 | Daily +0.36%; weekly +0.40% |
| WTI Crude Oil (CL=F) | $93.74 | 2026-10-12 | Daily +2.06%; weekly +4.82% |
| Effective Fed Funds Rate (DFF) | 3.88% | 2026-10-08 | Up from 3.63% since September 17 |
| Unemployment Rate (UNRATE) | 4.2% | 2026-09-01 | September reading |
| CPI Index (CPIAUCSL) | 334.131 | 2026-08-01 | August index level, about 3.4% above a year earlier |
Why the Index Stayed Calm
The VIX is calculated from S&P 500 index options, so it prices the expected volatility of the index as a whole, not of the companies inside it. When large stocks move in opposite directions, their gains and losses cancel out in the index. Monday was a clean example. Two of the four biggest technology names gained more than 1%, the other two lost more than 1%, and SPY ended 47 cents lower.
The same thing has been happening for two weeks. Over the past 10 sessions, SPY’s realized volatility, the annualized size of its actual daily moves, was about 7%. Over the same stretch NVIDIA moved at about a 23% pace, Apple 21% and Tesla 30%. The stocks have been lively. The index has been unusually quiet.
The weekly numbers show where the movement went. NVIDIA lost 5.27% from the October 5 close and finished 5.4% below its October 6 record. QQQ fell 1.34% and sits 1.8% below its own October 6 record. Apple rose 2.43% to within 0.1% of its September 25 record close, and Microsoft gained 3.04% to finish less than 0.2% below its October 2025 record. Leadership shifted among the largest stocks rather than away from stocks altogether.
A VIX of 15 Against an Index Moving at 7%
The VIX normally sits above the volatility the market is actually delivering. Option sellers want to be paid for the risk of a sudden drop, and buyers accept that cost for protection, so implied volatility tends to run a few points above realized volatility. Right now the gap is wide: 15.21 against roughly 7% over 10 sessions and 9.8% over 20.
That gap is the clearest sign of caution in the numbers. On its own, 15.21 looks calm. It is lower than about 85% of VIX closes over the past year, and far below this year’s high of 31.05 on March 27. But relative to how little the index has moved, investors are still paying a meaningful price for insurance. Since October 5 the VIX has stayed between 14.84 and 15.52, and it has not returned to its September 22 low of 14.21.
A wide gap can close in two ways. Calm can continue until option prices drift lower, or the index can start moving more and catch up with what the VIX has been pricing. The data does not say which comes next.
What 15.21 Means for SPY
The VIX is an annualized figure. Dividing by the square root of 12 converts it to a one-month range: 15.21 becomes about 4.4%, or roughly $34 either way on SPY’s close of $778.10. For a single day, divide by the square root of 252 instead. That gives about 0.96%, or around $7.45.
Monday’s 47-cent decline was a small fraction of that daily figure, and SPY’s recent moves have mostly been well inside it. These ranges describe the typical size of a move, not its direction. They are a way to read the VIX, not a forecast.
Rates, Oil and the Dollar
With the bond market closed, the 10-year yield stayed at Friday’s 5.24%. That is 7 basis points below the 5.31% close on October 5, the highest since May 2002. We looked at what drove that rise, mostly real yields rather than inflation expectations, in Why the 10-Year Treasury Yield Hit Its Highest Level Since 2002.
Oil moved more than anything else in the tables. WTI rose 2.06% to $93.74 and is up 4.82% from the October 5 close, more than reversing the previous week’s 3.42% decline. The dollar index rose 0.36% to 102.58. The effective fed funds rate remains 3.88% after the Federal Reserve’s quarter-point increase in September. Higher oil feeds directly into headline inflation, which puts more weight on the next CPI report.
What to Watch
- September CPI. The report was scheduled for Wednesday, October 14. August’s reading was about 3.4% above a year earlier, and the recent rise in oil prices raises the stakes. Release dates are on our economic calendar.
- The 14.8 to 15.5 range. A break above it would suggest the index is starting to move more. A drop toward September’s 14.21 low would suggest investors are relaxing.
- NVIDIA against Apple and Microsoft. As long as losses in one group are offset by gains in another, the index can stay calm. A day when all four fall together would test that.
- The 10-year when bonds reopen. Tuesday’s session will show whether yields resume their climb toward 5.31% or keep easing.
This is not financial advice.