Still Below the October Peak
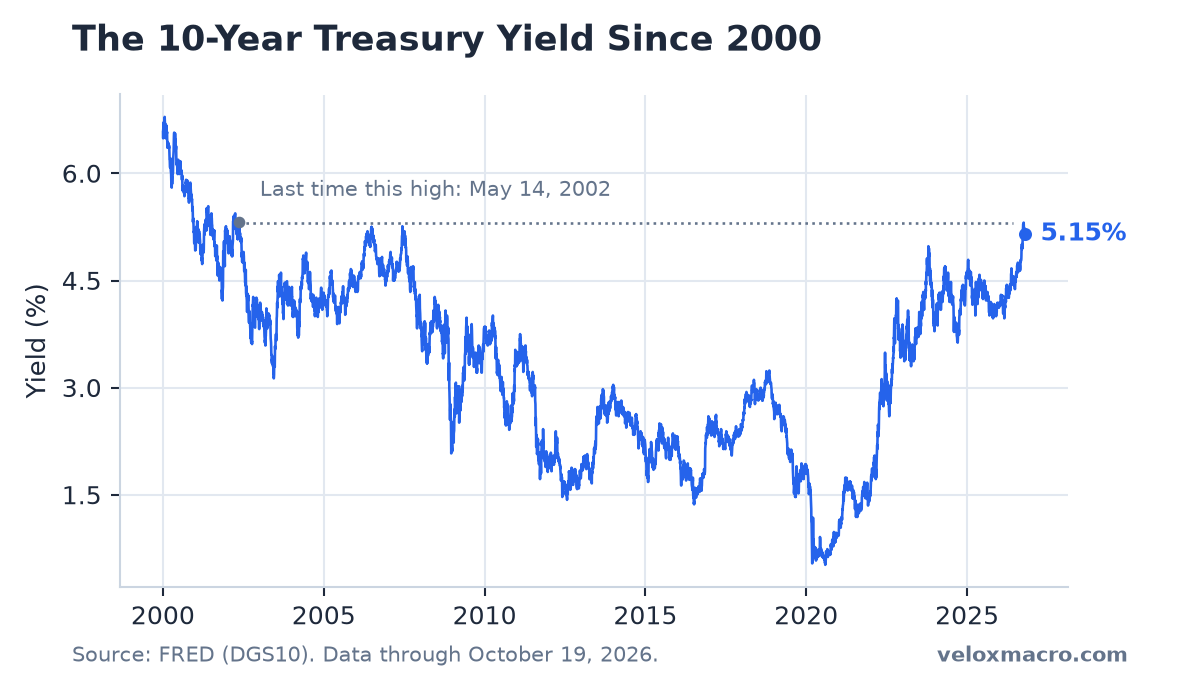
The 10-year Treasury yield eased to 5.12% on Tuesday, October 20, about 2 basis points below Monday and about 19 basis points below the 5.31% close on October 5, the highest since May 2002. The retreat from that peak is still mostly a lower real yield. The Federal Reserve meets on October 27 and 28.
New to Treasury yields? Start with our complete guide to the 10-year yield and weekly archive.
Key Market Data (session close: October 20, 2026)
The tables below reflect the Tuesday, October 20, 2026 U.S. close. Weekly changes run from the October 13 close. FRED’s daily Treasury series are published about one business day later, so their latest values here are for Monday, October 19. This analysis was published on October 22 and uses only data that was available at Tuesday’s close.
| Ticker | Close | Daily % Change | Weekly % Change |
|---|---|---|---|
| SPY | 769.05 | +0.34% | -1.15% |
| QQQ | 717.63 | -0.10% | -3.49% |
| AAPL | 339.50 | -1.00% | -0.52% |
| MSFT | 531.87 | -0.31% | -2.13% |
| NVDA | 216.47 | -0.29% | -5.27% |
| TSLA | 373.71 | +1.54% | -0.41% |
| Indicator | Latest Value | As Of | Notes |
|---|---|---|---|
| US 10-Year Treasury (^TNX) | 5.12% | 2026-10-20 | Daily -0.37%; weekly -1.92% |
| 10-Year Treasury (FRED DGS10) | 5.15% | 2026-10-19 | Official daily series |
| 2-Year Treasury (FRED DGS2) | 4.77% | 2026-10-19 | Most sensitive to expected Fed policy |
| 30-Year Treasury (FRED DGS30) | 5.48% | 2026-10-19 | Long end of the curve |
| 10-Year TIPS Real Yield (FRED DFII10) | 2.80% | 2026-10-19 | Yield after inflation |
| 10-Year Breakeven Inflation (FRED T10YIE) | 2.35% | 2026-10-19 | Inflation expected by bond investors |
| 30-Year Mortgage Rate (MORTGAGE30US) | 7.40% | 2026-10-15 | Freddie Mac weekly average |
| Effective Fed Funds Rate (DFF) | 3.88% | 2026-10-19 | Up from 3.63% since September 17 |
| VIX Index (^VIX) | 17.31 | 2026-10-20 | Daily -6.13%; weekly +13.36% |
| US Dollar Index (DX-Y.NYB) | 101.73 | 2026-10-20 | Daily -0.25%; weekly -0.44% |
| WTI Crude Oil (CL=F) | $101.79 | 2026-10-20 | Daily -1.80%; weekly +8.13% |
| CPI Index (CPIAUCSL) | 336.298 | 2026-09-01 | September index, about 3.7% above a year earlier |
Nineteen Basis Points Off the High
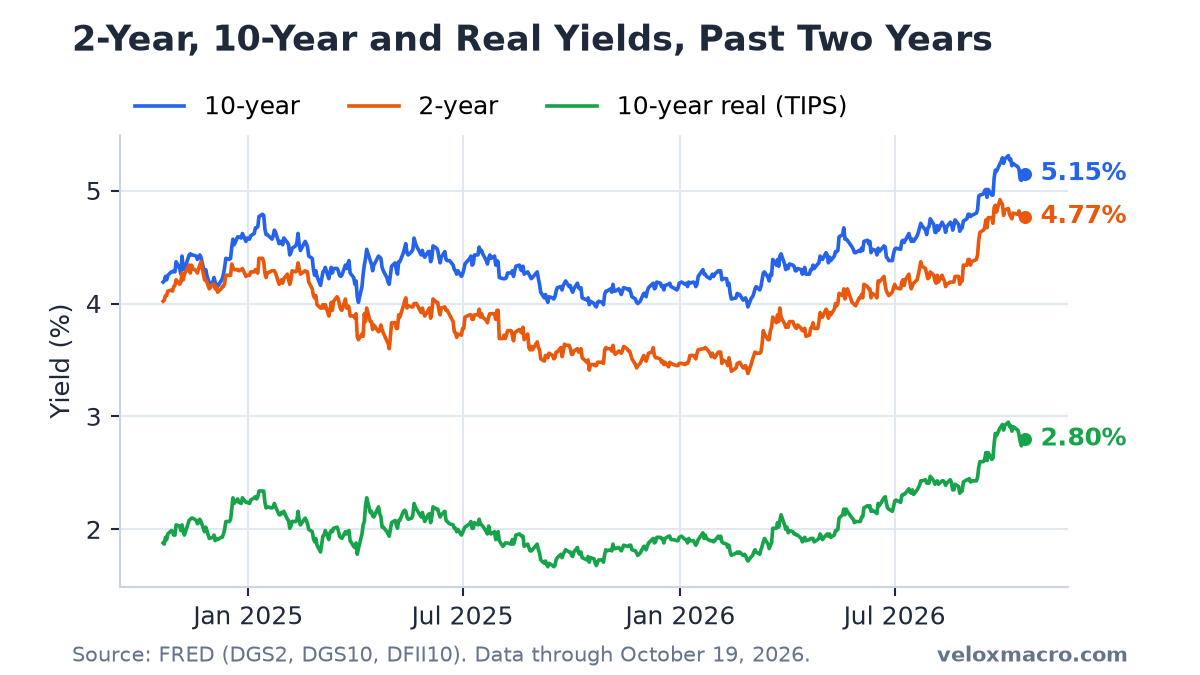
Tuesday’s 0.37% drop in ^TNX is about 2 basis points, from 5.14% to 5.12%. Over the week from October 13 the yield is down about 10 basis points, from 5.22%. Since the October 5 high of 5.31%, the market quote has closed as low as 5.09% on October 15, then finished Tuesday at 5.12%. The climb has stopped. Most of September’s rise is still in the price: the 10-year was 4.80% on September 8.
The Decline Is Still a Real-Yield Move
A regular 10-year yield splits into a real yield, from inflation-protected Treasuries (TIPS), and a breakeven rate, the inflation investors expect over ten years. The two add up to the regular yield.
FRED’s readings through October 19, the latest available at Tuesday’s close, compared with October 5:
- 10-year yield: 5.31% to 5.15%, down 16 basis points.
- 10-year real yield: 2.95% to 2.80%, down 15 basis points.
- 10-year breakeven inflation: 2.36% to 2.35%, down 1 basis point.
September CPI, released on October 14, rose to about 3.7% from a year earlier, up from 3.4% in August. The breakeven rate did not follow it higher. Bond investors marked down the real yield and left long-term inflation expectations about where they were at the peak. That is the same split as the climb into October 5, which was also almost entirely a real-yield move. We covered that rise in Why the 10-Year Treasury Yield Hit Its Highest Level Since 2002.
The Long End Gave Back More Than the Short End
The 2-year yield, which tracks expected Fed policy more closely than the 10-year does, was 4.77% on October 19. It was 4.84% on October 5, so it is down 7 basis points while the 10-year is down 16. The gap between them narrowed from 47 basis points on October 5 to 38 on October 19. The 30-year yield fell from 5.66% to 5.48% over the same dates.
The Federal Reserve Board’s estimate of the 10-year term premium, the extra yield for holding a long bond instead of rolling short-term bills, has come off its high as well. It was 1.10% on October 5, the highest since April 2010, and 0.99% on October 16. That is a step down from the peak, and it is still near 1%.
The 2-year at 4.77% still sits well above the effective fed funds rate of 3.88%. That gap is the market’s read on the path of short-term rates over the next two years. It is not a forecast of the October 27–28 decision by itself.
Mortgages Stayed at 7.40%
Freddie Mac’s survey on October 15 left the average 30-year mortgage rate at 7.40%, the same as October 8 and the highest since November 2023. Treasury yields fell during the week that survey covers, from about 5.22% on October 13 to 5.09% on October 15. The mortgage rate did not. The gap versus the 10-year was about 2.3 percentage points, wider than the 1.5-to-2 point range that has been typical, and wider than the roughly 2.2 points a week earlier. The next survey is due on Thursday, October 22.
Stocks Were Mixed
SPY rose 0.34% to 769.05, about 1.3% below its October 6 record. QQQ slipped 0.10% to 717.63 and is about 5.5% below its own October 6 record. Apple fell 1.00% to 339.50, off the record close it set on October 16. NVIDIA is down 5.27% on the week. The VIX fell 6.13% to 17.31, a second down day after Friday’s close at 19.99, and still above the mid-teens range from earlier in October.
Oil eased 1.80% to $101.79 and remains above $100. The dollar index slipped 0.25% to 101.73.
What to Watch
- The Fed meeting on October 27–28. The decision is due at 2:00 p.m. ET on October 28, with the Chair’s press conference at 2:30 p.m. This meeting does not include a new Summary of Economic Projections. The 2-year yield is the cleaner market gauge than the 10-year. Dates are on our economic calendar.
- The real yield near 2.80%. It has accounted for nearly all of the move down from 5.31%. A hot inflation print that lifts the breakeven rate would be a different kind of rise.
- The 5.09% low from October 15. A close below it would extend the pullback. A move back above 5.31% would restart the climb.
- Thursday’s mortgage survey. Yields are lower than when the last 7.40% reading was set. The question is whether the mortgage rate follows.
This is not financial advice.