The 10-Year Backs Off Its High Before the CPI Report
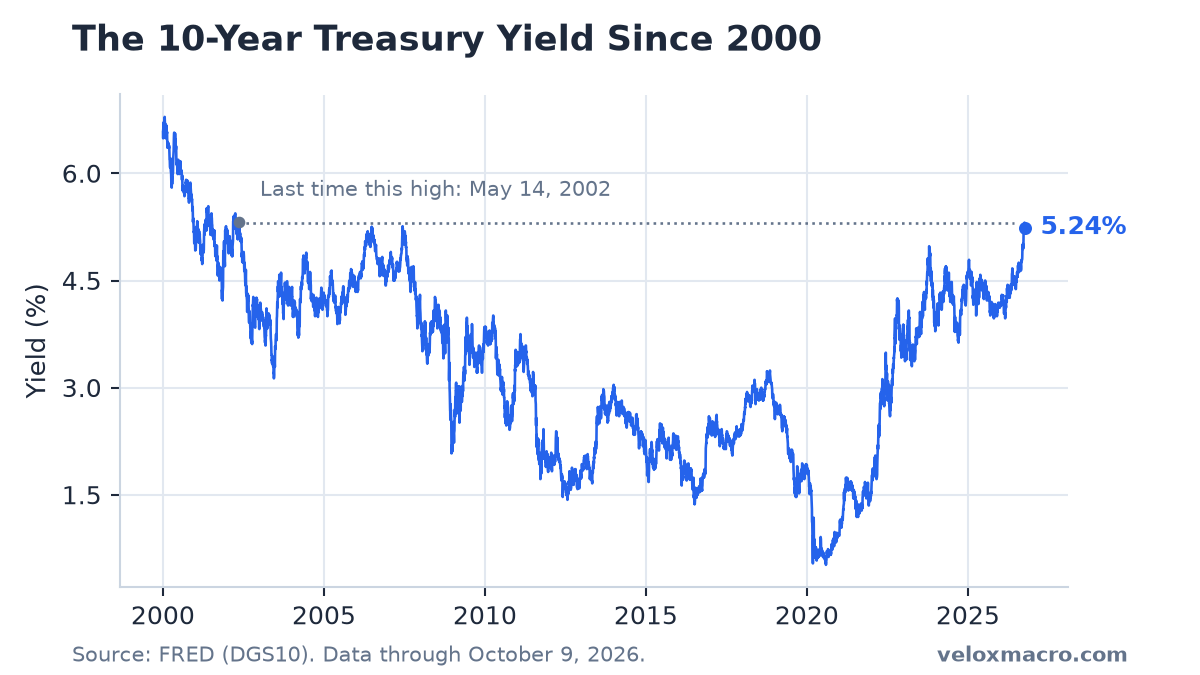
The 10-year Treasury yield fell about 2 basis points to 5.22% on Tuesday, October 13, its lowest close since September 25. It is now 9 basis points below the 5.31% close on October 5, the highest since May 2002. The pullback looks different from the climb: the rise was almost all real yield, while the decline since the peak has come about equally from real yields and inflation expectations. Apple and Microsoft both closed at records.
New to Treasury yields? Start with our complete guide to the 10-year yield and weekly archive.
Key Market Data (session close: October 13, 2026)
The tables below reflect the Tuesday, October 13, 2026 U.S. close. Weekly changes run from the October 6 close. The bond market was closed on Monday for Columbus Day, so Tuesday was its first session since Friday. FRED’s daily Treasury series are published about one business day later, so their latest values are for Friday, October 9. This analysis was published on October 15 and uses only data that was available at Tuesday’s close.
| Ticker | Close | Daily % Change | Weekly % Change |
|---|---|---|---|
| SPY | 778.01 | -0.01% | -0.14% |
| QQQ | 743.57 | -0.33% | -2.12% |
| AAPL | 341.27 | +0.09% | +2.29% |
| MSFT | 543.45 | +0.43% | +2.67% |
| NVDA | 228.52 | +0.97% | -4.48% |
| TSLA | 375.23 | -0.74% | -1.43% |
| Indicator | Latest Value | As Of | Notes |
|---|---|---|---|
| US 10-Year Treasury (^TNX) | 5.22% | 2026-10-13 | Daily -0.44%; weekly -0.99% |
| 10-Year Treasury (FRED DGS10) | 5.24% | 2026-10-09 | Official daily series |
| 2-Year Treasury (FRED DGS2) | 4.80% | 2026-10-09 | Most sensitive to expected Fed policy |
| 30-Year Treasury (FRED DGS30) | 5.60% | 2026-10-09 | Long end of the curve |
| 10-Year TIPS Real Yield (FRED DFII10) | 2.91% | 2026-10-09 | Yield after inflation |
| 10-Year Breakeven Inflation (FRED T10YIE) | 2.33% | 2026-10-09 | Inflation expected by bond investors |
| 30-Year Mortgage Rate (MORTGAGE30US) | 7.40% | 2026-10-08 | Freddie Mac weekly average |
| Effective Fed Funds Rate (DFF) | 3.88% | 2026-10-12 | Up from 3.63% since September 17 |
| VIX Index (^VIX) | 15.27 | 2026-10-13 | Daily +0.39%; weekly +1.73% |
| US Dollar Index (DX-Y.NYB) | 102.18 | 2026-10-13 | Daily -0.39%; weekly +0.34% |
| WTI Crude Oil (CL=F) | $94.14 | 2026-10-13 | Daily +0.43%; weekly +5.25% |
| CPI Index (CPIAUCSL) | 334.131 | 2026-08-01 | August index level, about 3.4% above a year earlier |
A Slow Retreat From the Peak
Tuesday’s 0.44% drop in ^TNX works out to about 2 basis points, from 5.24% to 5.22%. Over the week the yield is down about 5 basis points. In the bond sessions since the October 5 high, it has closed at 5.27%, 5.28%, 5.23%, 5.24% and now 5.22%. That is a slow retreat, not a reversal. The yield is still about 40 basis points above where it was in early September.
The Climb and the Pullback Have Different Drivers
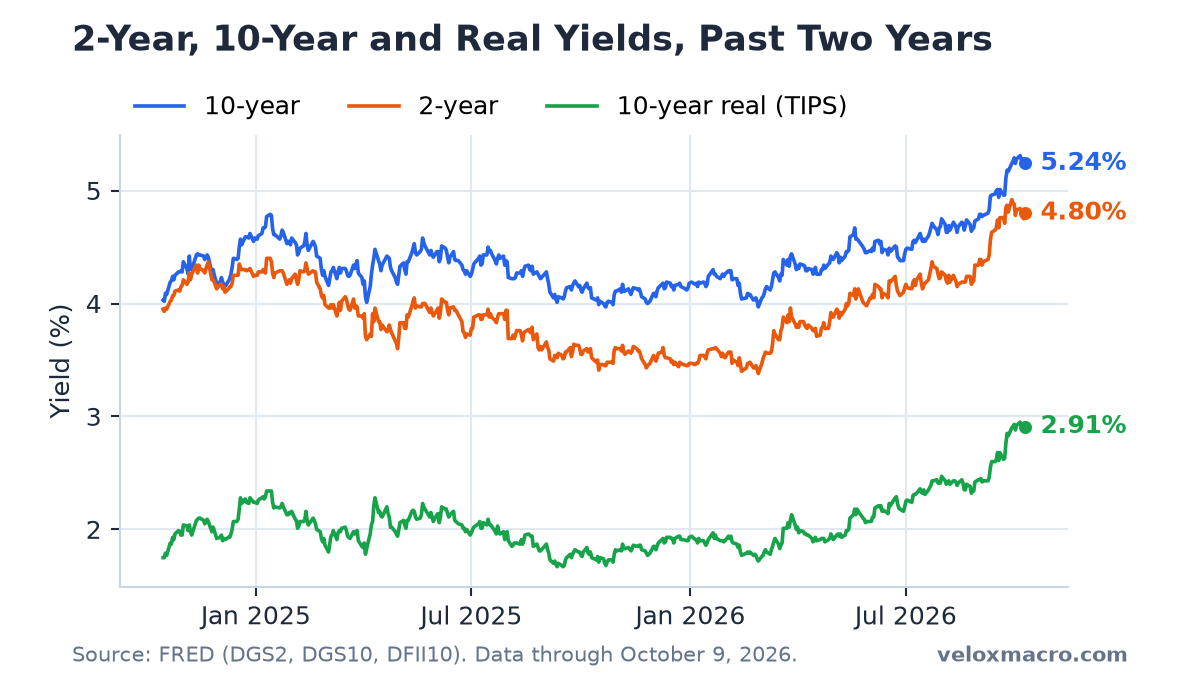
The regular 10-year yield can be split into two parts using inflation-protected Treasuries, or TIPS. The TIPS yield is the real yield, the return after inflation. The gap between the two is the breakeven rate, the inflation bond investors expect over ten years. Together they add up to the regular yield.
In last week’s analysis, the rise from September 8 to October 5 came entirely from the real yield, which climbed 52 basis points while the breakeven rate did not move. FRED’s data through October 9 shows the first part of the retreat:
- 10-year yield: 5.31% on October 5, 5.24% on October 9, down 7 basis points.
- 10-year real yield: 2.95% to 2.91%, down 4 basis points.
- 10-year breakeven inflation: 2.36% to 2.33%, down 3 basis points.
The breakeven rate edged lower even as oil climbed, and it is below the 2.37% of September 8. Bond investors have not added inflation fears on top of the higher real yields. With the September CPI report due on Wednesday, October 14, that is the piece most likely to change. A hot reading would show up first in the breakeven rate.
The Curve and the Term Premium
The 2-year yield ended Friday at 4.80%, close to where it was on October 5. The 10-year minus 2-year spread was 44 basis points, a little below the 47 reached on October 5, and the 30-year yield eased from 5.66% to 5.60%. In other words, the long end has given back more than the short end, which is the reverse of how the yield curve steepened in late September.
The Federal Reserve Board’s estimate of the 10-year term premium, the extra yield investors demand for holding a long bond instead of rolling short-term bills, tells a similar story. It reached 1.10% on October 5, its highest since April 2010, and stood at 1.07% on October 9. That is a small step down from a high level.
Mortgages Have Not Followed
Freddie Mac’s weekly survey put the average 30-year mortgage rate at 7.40% on October 8, up from 7.28% a week earlier and 6.71% on September 3. It is the highest reading since November 2023. Mortgage rates usually run 1.5 to 2 percentage points above the 10-year yield. Against the 10-year’s 5.22% close on October 8, the gap was about 2.2 points, wider than that usual range. The survey covers the days around the yield peak, so it does not yet reflect the small decline since then. The next one is due on Thursday, October 15.
Records for Apple and Microsoft
The stock market barely moved. SPY slipped 0.01% to 778.01, about 0.1% below its October 6 record. Apple rose 0.09% to 341.27, just above its September 25 record close, and Microsoft rose 0.43% to 543.45, topping a record close that had stood since October 2025. QQQ fell 0.33% and is 2.1% below its October 6 record. NVIDIA, one of its largest holdings, is down 4.48% on the week despite Tuesday’s 0.97% gain.
Higher real yields raise the return available without stock market risk, which usually weighs on valuations. So far, investors are choosing which stocks to own rather than selling broadly. The VIX at 15.27 shows only modest caution.
What to Watch
- September CPI on Wednesday, October 14. August’s reading was about 3.4% above a year earlier. Watch the breakeven rate, which has not risen since early September. Release times are on our economic calendar.
- The 5.2% level. A close below it would put the 10-year back where it was in late September. A return above 5.31% would restart the climb.
- The Fed meeting on October 27 and 28. The effective fed funds rate is 3.88% after September’s quarter-point increase. The 2-year yield is the best market gauge of what investors expect.
- Thursday’s mortgage survey. Another reading above 7.4% would widen the gap with Treasury yields further.
This is not financial advice.