A Record for QQQ, but the VIX Is Not Relaxed
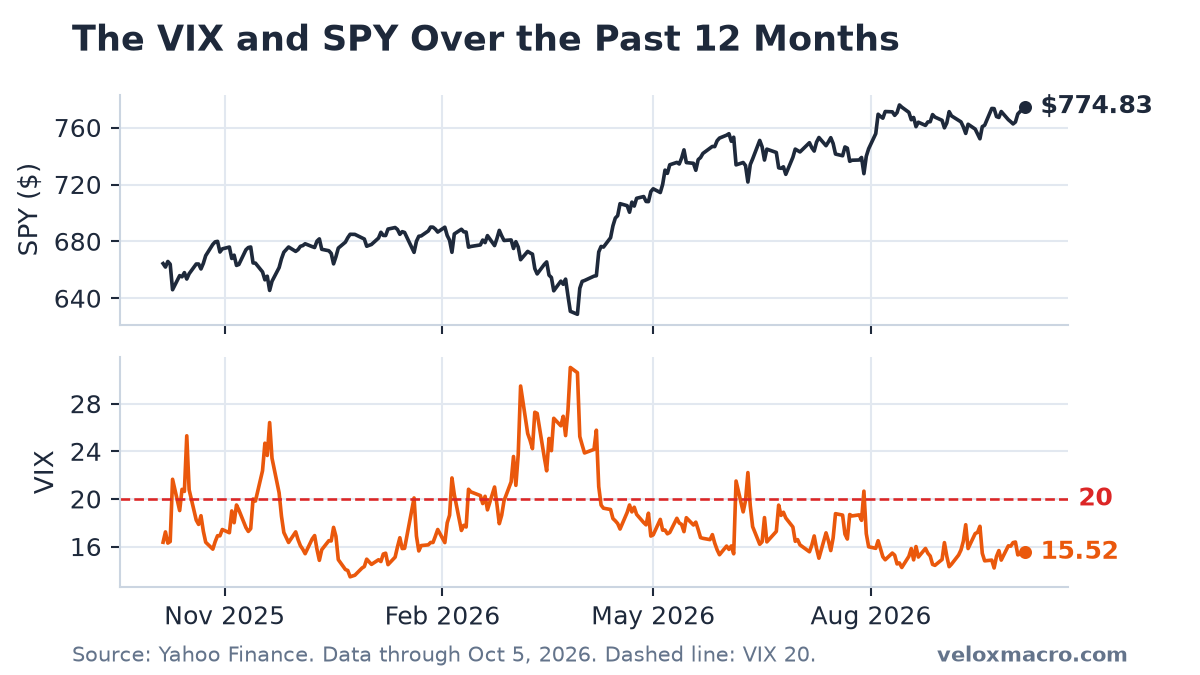
Stocks rose again on Monday, October 5. QQQ gained 0.88% to 756.20, its second record close in a row, and NVIDIA closed at a record 238.90. SPY finished 0.4% below its August high. The VIX did not fall with them. It rose 1.37% to 15.52, and on a day when the 10-year Treasury yield closed at 5.31%, its highest close since May 2002, that is the more telling number.
New to the VIX? Start with our complete VIX guide and weekly archive.
Key Market Data (session close: October 5, 2026)
The tables below reflect the Monday, October 5, 2026 U.S. close. Weekly changes run from the September 28 close. Macro rows use each indicator’s own as-of date; CPI and unemployment are monthly FRED series and trail market prices by weeks.
| Ticker | Close | Daily % Change | Weekly % Change |
|---|---|---|---|
| SPY | 774.83 | +0.67% | +1.20% |
| QQQ | 756.20 | +0.88% | +2.67% |
| AAPL | 332.89 | -0.24% | -1.63% |
| MSFT | 525.18 | +1.48% | +3.13% |
| NVDA | 238.90 | +2.12% | +4.39% |
| TSLA | 378.73 | +2.20% | +5.95% |
| Indicator | Latest Value | As Of | Notes |
|---|---|---|---|
| VIX Index (^VIX) | 15.52 | 2026-10-05 | Daily +1.37%; weekly -3.42% |
| 10-Year Treasury Yield (^TNX) | 5.31% | 2026-10-05 | Daily +0.64%; weekly +1.35% |
| 10-Year Treasury (FRED DGS10) | 5.28% | 2026-10-02 | Official daily series, one session behind ^TNX |
| US Dollar Index (DX-Y.NYB) | 102.17 | 2026-10-05 | Daily +0.24%; weekly +0.96% |
| WTI Crude Oil (CL=F) | $89.43 | 2026-10-05 | Daily -1.84%; weekly -3.42% |
| Effective Fed Funds Rate (DFF) | 3.88% | 2026-10-02 | Up from 3.63% since September 17 |
| Unemployment Rate (UNRATE) | 4.2% | 2026-09-01 | September reading |
| CPI Index (CPIAUCSL) | 334.131 | 2026-08-01 | August index level, about 3.4% above a year earlier |
Stocks Up, VIX Up
The VIX usually moves opposite to the S&P 500. When stocks rise, demand for downside protection eases, option prices fall, and the VIX drops. Since 1993, the S&P 500 and the VIX have both closed higher on only about 11% of trading days. Monday was one of them: SPY rose 0.67% and the VIX rose 1.37%.
One day like this is not a signal by itself, and the move was small. It fits a broader pattern, though. Over the past two weeks the VIX has stayed between about 14.9 and 16.4 while stocks went from a soft patch to new records. On Friday, after the jobs report, the VIX fell 6.59% to 15.31. By Monday it was rising again even as QQQ set another record.
How High Is 15.5 for a Market Near Records?
On its own, 15.52 is an unremarkable reading. It is below 20, the line usually used for elevated stress, and far below this year’s high of 31.05 on March 27. The comparison that matters here is different. Since 1993, on days when the S&P 500 closed at or within 0.1% of a record, the median VIX close has been about 13.6. The S&P 500 finished Monday about 0.3% below its August 13 record, and the VIX is roughly two points above that typical level.
In other words, option buyers are paying more for protection than they usually do when stocks are this close to the top. The VIX’s September low was 14.21, on September 22, the day before the 10-year yield jumped almost 15 basis points. It has not been back to that level since.
What the VIX Number Means in Dollars
The VIX is an annualized estimate of S&P 500 volatility over the next 30 days, taken from option prices. To turn it into something practical, divide by the square root of 12 for a one-month move: 15.52 becomes about 4.5%. On SPY’s close of $774.83, that is roughly $35 up or down. For a single day, divide by the square root of 252 instead, which gives about 1.0%, or around $7.60 on SPY.
Monday’s 0.67% gain was well inside that one-day range. These figures describe the size of a typical move, not its direction, and real markets do not spread volatility evenly. They are a way to read the VIX, not a forecast.
Why Protection Might Stay Expensive
The tables point to rates as the likely source of the extra caution. The 10-year yield rose another 0.64% on Monday to about 5.31%, a new high for this move and the highest close since May 2002. The Federal Reserve raised its target range by a quarter point in mid-September, and the effective fed funds rate is now 3.88%. The dollar index rose to 102.17. Oil is not adding to the pressure: WTI fell 1.84% to $89.43 and is down 3.42% on the week.
High rates do not have to hurt stocks right away, and so far they have not hurt the largest ones. NVIDIA is up 4.39% on the week, Microsoft 3.13% and Tesla 5.95%. Apple was the exception, down 1.63%. But the combination of record highs in growth stocks and the highest long-term yields in more than two decades is exactly the kind of setup in which investors keep buying insurance. The VIX staying in the mid-teens instead of drifting toward 13 is consistent with that, even if the data cannot prove it.
What to Watch
- The VIX on up days. More sessions where stocks and the VIX rise together would show hedging demand building under the surface.
- The 14.21 low. A drop back toward September’s low would suggest the market has absorbed the rate move.
- The 10-year above 5.3%. Further gains would test whether the largest stocks can keep rising with yields at their highest since 2002.
- September CPI. The report is due in mid-October. A hotter reading than August’s 3.4% annual pace would add to rate pressure and could lift the VIX.
This is not financial advice.